 Global| Feb 17 2004
Increases in Industrial Production in Russia Outpace Those in Western Europe and in the U.S.
Summary
Industrial production in the Euro-zone, the U. S. and the UK has been essentially flat since 2000. The flat trend in the Euro-zone, as a whole, is the result of above average performance in some countries, notably Ireland and below [...]
Industrial production in the Euro-zone, the U. S. and the UK has been essentially flat since 2000. The flat trend in the Euro-zone, as a whole, is the result of above average performance in some countries, notably Ireland and below average performance in others, notable Italy and the Netherlands.
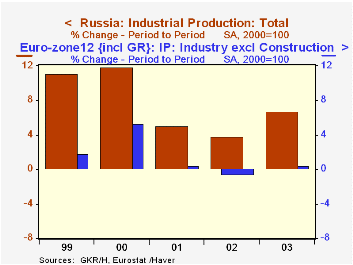
While there has been no discernible trend in industrial production in western Europe and the US over the past three years, industrial production in Russia has forged ahead. Industrial production in December 2003 was 8.1% above the corresponding period of 2002. For all of 2003 the increase was 6.75%, which followed yearly increases of 3.80% and 5.05% in 2002 and 2001 respectively.
| Industrial Production (2000=100) | Dec 04 | Nov 04 | Dec 03 | M/M % | Y/Y % | 2003 | 2002 | 2001 |
|---|---|---|---|---|---|---|---|---|
| Euro-zone | 101.45 | 101.28 | 99.23 | 0.17 | 2.24 | 100.35 | 99.94 | 100.52 |
| France | 100.70 | 100.40 | 98.70 | 0.30 | 2.03 | 99.58 | 99.89 | 101.18 |
| Germany | 101.80 | 101.30 | 98.30 | 0.49 | 3.56 | 99.63 | 99.09 | 100.27 |
| Italy | 97.80 | 98.06 | 97.70 | -0.20 | 0.10 | 97.46 | 97.96 | 99.33 |
| Spain | 100.73 | 101.21 | 99.69 | -0.47 | 1.04 | 100.62 | 99.29 | 99.18 |
| Ireland | 130.45 | 134.31 | 111.63 | -2.87 | 16.86 | 126.24 | 118.53 | 110.04 |
| Netherlands | 95.10 | 97.40 | 98.90 | -2.36 | -3.84 | 97.33 | 99.51 | 100.51 |
| United States (1997=100) | 114.7 | 114.5 | 111.9 | 0.17 | 2.50 | 112.6 | 112.5 | 113.1 |
| United Kingdom | 94.6 | 94.70 | 95.40 | -0.11 | -0.84 | 95.03 | 95.74 | 98.43 |
| Russia | 118.4 | 116.9 | 109.5 | 1.28 | 8.13 | 115.7 | 108.4 | 104.4 |
More Economy in Brief


