 Global| Mar 15 2006
Import Prices Back Down
by:Tom Moeller
|in:Economy in Brief
Summary
One month U.S. import prices move up, the next month they're down. And sometimes, they remain unchanged. All three possibilities have been in evidence since last November. The trend is up but the rate of increase appears to have [...]
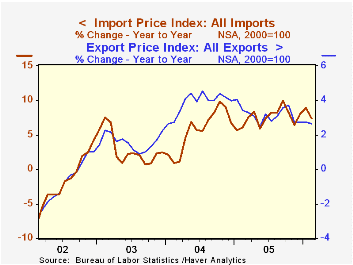
One month U.S. import prices move up, the next month they're down. And sometimes, they remain unchanged. All three possibilities have been in evidence since last November. The trend is up but the rate of increase appears to have topped, but for how long? Last month, total import prices fell an expected 0.5% after a revised 1.4% jump during January.
Nonpetroleum import prices dropped 0.5% during February and reversed the upwardly revised 0.3% January rise. The fall reflected lower prices of foods, feeds and beverages where a 1.7% decline (+4.1% y/y) reversed much of the prior two months' strength. Industrial materials prices less petroleum also fell a sharp 2.2% (+9.9% y/y) due to a 19.2% m/m decline in natural gas prices (+40.8% y/y). 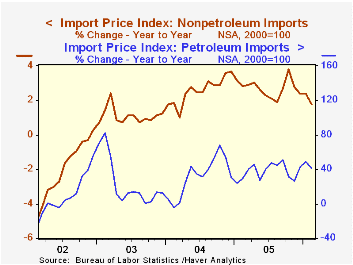
Prices for nonauto consumer goods were unchanged (-0.4% y/y) for the second month in the last three but capital goods prices rose 0.2% (-1.3% y/y). Excluding a 0.1% decline in computer prices (-6.4% y/y), capital goods prices rose 0.4% (1.0% y/y). Motor vehicle & parts prices rose 0.1% (0.4% y/y).
Petroleum prices also reversed course last month and fell 0.7% after a 6.9% spike during January. Crude oil prices dipped 0.9% (39.95 y/y) after an 8.7% spike during January. So far in March the price of Brent Crude has averaged $60.80 versus $60.19 per bbl. during February.
During the last ten years there has been a 66% (negative) correlation between the nominal trade-weighted exchange value of the US dollar vs. major currencies and the y/y change in non oil import prices. The correlation is a lower 47% against a broader basket of currencies and a lower 57% against the real value of the dollar.
Export prices were unchanged m/m and the 2.6% y/y gain was below the increases of 2004 and 2005.
| Import/Export Prices (NSA) | Feb | Jan | Y/Y | 2005 | 2004 | 2003 |
|---|---|---|---|---|---|---|
| Import - All Commodities | -0.5% | 1.4% | 7.4% | 7.5% | 5.6% | 2.9% |
| Petroleum | -0.7% | 6.9% | 40.8% | 37.6% | 30.5% | 21.0% |
| Non-petroleum | -0.5% | 0.3% | 1.8% | 2.7% | 2.6% | 1.1% |
| Export - All Commodities | 0.0% | 0.7% | 2.6% | 3.2% | 3.9% | 1.6% |

Tom Moeller
AuthorMore in Author Profile »Prior to joining Haver Analytics in 2000, Mr. Moeller worked as the Economist at Chancellor Capital Management from 1985 to 1999. There, he developed comprehensive economic forecasts and interpreted economic data for equity and fixed income portfolio managers. Also at Chancellor, Mr. Moeller worked as an equity analyst and was responsible for researching and rating companies in the economically sensitive automobile and housing industries for investment in Chancellor’s equity portfolio. Prior to joining Chancellor, Mr. Moeller was an Economist at Citibank from 1979 to 1984. He also analyzed pricing behavior in the metals industry for the Council on Wage and Price Stability in Washington, D.C. In 1999, Mr. Moeller received the award for most accurate forecast from the Forecasters' Club of New York. From 1990 to 1992 he was President of the New York Association for Business Economists. Mr. Moeller earned an M.B.A. in Finance from Fordham University, where he graduated in 1987. He holds a Bachelor of Arts in Economics from George Washington University.
More Economy in Brief


