 Global| May 18 2004
Housing Starts Down As Expected
by:Tom Moeller
|in:Economy in Brief
Summary
Housing starts fell 2.1% last month from the near-record level in March, that was revised slightly higher. April starts of 1.969M compared to the Consensus expectation for 1.98M. Single family starts slipped a modest 0.6% from the [...]
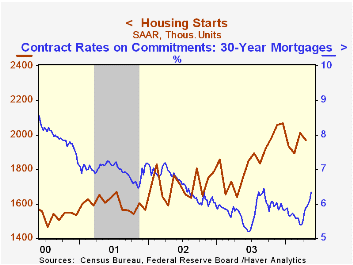
Housing starts fell 2.1% last month from the near-record level in March, that was revised slightly higher. April starts of 1.969M compared to the Consensus expectation for 1.98M.
Single family starts slipped a modest 0.6% from the upwardly revised March level. Nevertheless, April single-family starts were 3.6% below the record of November 2003.
Multi-family starts fell 8.4% and the surge in March was revised to show less of an increase.
The decline in housing starts last month was dominated by a 13.7% (+0.2 y/y) decline in the West. Elsewhere, housing starts rose. In the Northeast starts rose 0.6% (19.0% y/y) and the March decline was lessened. In the South starts added 1.2% (+31.7% y/y) and in the Midwest starts rose 4.5% (+23.1% y/y).
Building permits rose 1.2% m/m (+11.2% y/y).
| Housing Starts (000s, AR) | April | Mar | Y/Y | 2003 | 2002 | 2001 |
|---|---|---|---|---|---|---|
| Total | 1,969 | 2,011 | 20.3% | 1,848 | 1,711 | 1,601 |
| Single-family | 1,610 | 1,619 | 18.1% | 1,501 | 1,364 | 1,272 |
| Multi-family | 359 | 392 | 31.0% | 347 | 347 | 330 |
| Building Permits | 1,999 | 1,975 | 11.2% | 1,831 | 1,750 | 1,637 |
by Tom Moeller May 18, 2004
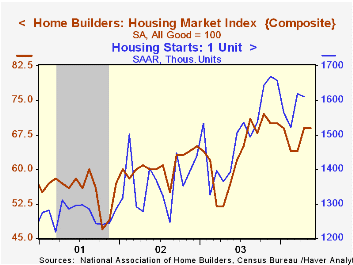
The Composite Housing Market Index reported by the National Association of Home Builders (NAHB) remained at the improved level of 69 in May.
During the last fifteen years there has been a 79% correlation between the y/y change in the NAHB index and the change in single family housing starts.
The unchanged total reflected mixed patterns amongst the sub components. The index of expected single family home sales in six months fell slightly and the current sales index fell moderately. However, prospects in six months for sales of townhouses and condominiums improved.
Traffic of prospective buyers improved sharply in May (+37.5% y/y).
The NAHB index is a diffusion index based on a survey of builders. Readings above 50 signal that more builders view conditions as good than poor.
Visit the National Association of Home Builders using this link.
| Nat'l Association of Home Builders | May | April | May '03 | 2003 | 2002 | 2001 |
|---|---|---|---|---|---|---|
| Composite Housing Market Index | 69 | 69 | 57 | 64 | 61 | 56 |
by Tom Moeller May 18, 2004
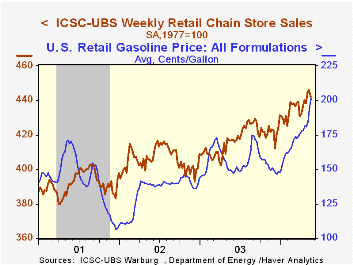
Chain store sales slipped 0.8% last week following two weeks of moderate gain, according to the International Council of Shopping Centers (ICSC)-UBS.
So far in May sales are 1.3% above the April average due to a 1.5% jump at the end of last month.
During the last ten years there has been a 59% correlation between y/y change in chain store sales and the change in non-auto retail sales less gasoline.
The ICSC-UBS retail chain-store sales index is constructed using the same-store sales reported by 78 stores of seven retailers: Dayton Hudson, Federated, Kmart, May, J.C. Penney, Sears and Wal-Mart.
The rise gasoline prices to an average $2.02 per gallon last week (+34.6% y/y) may finally be curtailing the momentum in consumer spending.
For analysis of higher gasoline and energy prices on the consumer from the Federal Reserve Bank of Dallas see the following two articles: U.S. Gasoline Prices on the Rise Once Again and Energy Prices and the Economy
| ICSC-UBS (SA, 1977=100) | 05/15/04 | 05/08/04 | Y/Y | 2003 | 2002 | 2001 |
|---|---|---|---|---|---|---|
| Total Weekly Retail Chain Store Sales | 442.2 | 445.9 | 6.2% | 2.9% | 3.6% | 2.1% |
by Tom Moeller May 18, 2004
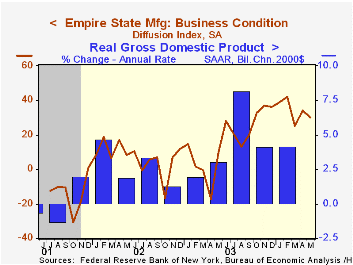
The Empire State Index of General Business Conditions fell in May to 30.21 and the sharp rise the month prior was lessened. Nevertheless, the readings in both months remained quite improved versus last year.
The new orders index in fact improved sharply, about to the record high, following the jump in April. The shipments index also added to the April gain and is at another series' high. Finally, the employment index rose for the second month this year.
The prices paid index slipped a bit to 56.67 from the upwardly revised record high in April.
The April index of expectations for business conditions six months ahead improved following the sharp decline in April. Expectations for capital expenditures fell to the lowest level since January.
The Empire State Manufacturing Survey is a monthly survey of manufacturers in New York State conducted by the Federal Reserve Bank of New York. Participants from across the state in a variety of industries respond to a questionnaire and report the change in a variety of indicators from the previous month. Respondents also state the likely direction of these same indicators six months ahead. April 2002 is the first report, although survey data date back to July 2001.
Like the Philadelphia Fed Index of General Business Conditions, the Empire State Business Conditions Index reflects answers to an independent survey question, not the components.
For more on the Empire State Manufacturing Survey, including methodologies and the latest report, click here.
| Empire State Manufacturing Survey | May | April | 5/03 | 2003 | 2002 | 2001 |
|---|---|---|---|---|---|---|
| General Business Conditions (diffusion index) | 30.21 | 34.03 | 9.75 | 16.30 | 7.02 | -13.57 |

Tom Moeller
AuthorMore in Author Profile »Prior to joining Haver Analytics in 2000, Mr. Moeller worked as the Economist at Chancellor Capital Management from 1985 to 1999. There, he developed comprehensive economic forecasts and interpreted economic data for equity and fixed income portfolio managers. Also at Chancellor, Mr. Moeller worked as an equity analyst and was responsible for researching and rating companies in the economically sensitive automobile and housing industries for investment in Chancellor’s equity portfolio. Prior to joining Chancellor, Mr. Moeller was an Economist at Citibank from 1979 to 1984. He also analyzed pricing behavior in the metals industry for the Council on Wage and Price Stability in Washington, D.C. In 1999, Mr. Moeller received the award for most accurate forecast from the Forecasters' Club of New York. From 1990 to 1992 he was President of the New York Association for Business Economists. Mr. Moeller earned an M.B.A. in Finance from Fordham University, where he graduated in 1987. He holds a Bachelor of Arts in Economics from George Washington University.
More Economy in Brief


