Global| Mar 18 2009
Higher Energy Prices Lift U.S. CPI By Most Since July; Core Pricing Power Firm
by:Tom Moeller
|in:Economy in Brief
Summary
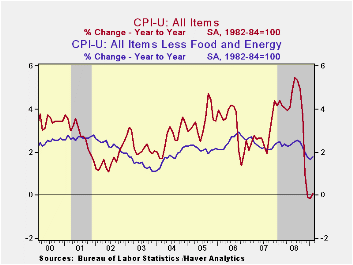
Last year's sharp decline in energy prices came to an abrupt end with the turn of the calendar page to 2009; and the consumer price index published by the Bureau of Labor Statistics (along with consumers' wallets) noted the shift. [...]
 Last
year's sharp decline in energy prices came to an abrupt end with the
turn of the calendar page to 2009; and the consumer price index
published by the Bureau of Labor Statistics (along with consumers'
wallets) noted the shift. During February, the CPI rose for only the
second time since July. The 0.4% increase followed an unrevised 0.3%
January gain as a 3.3% rise in energy prices roughly doubled their
January increase. The latest increase in the CPI slightly
outpaced Consensus expectations for a 0.3% rise.
Last
year's sharp decline in energy prices came to an abrupt end with the
turn of the calendar page to 2009; and the consumer price index
published by the Bureau of Labor Statistics (along with consumers'
wallets) noted the shift. During February, the CPI rose for only the
second time since July. The 0.4% increase followed an unrevised 0.3%
January gain as a 3.3% rise in energy prices roughly doubled their
January increase. The latest increase in the CPI slightly
outpaced Consensus expectations for a 0.3% rise.
The increase in energy prices reflected higher gasoline prices which jumped by 8.3% following the 6.0% January rise. Despite these gains, however, prices are more than one-third lower versus last February. This month gasoline prices have held the higher February level of $1.92 per gallon of regular but this week have moved even higher. Offsetting some of that upward pressure have been lower fuel oil prices. They fell 1.8% last month (-21.4% y/y) and have fallen in each month since July. Similarly, prices for natural gas & electricity have fallen in all but one of the last seven months though they still are 5.7% higher than last February.
Some of that upward pressure has been relieved by a
moderation in food & beverage price increases. 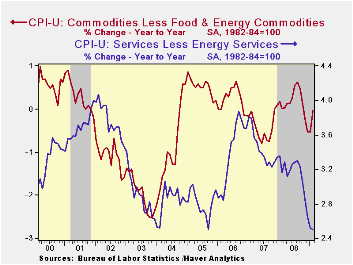 Prices actually
slipped 0.1% last month after 0.1% upticks during January and
December. Nevertheless, food prices still are a firm 4.7% higher than
last year but that's versus a 6.3% comparison this past fall. Recent
weakness has been led by lower dairy product prices (-1.7% y/y) and
five consecutive months of slight decline in meat and dairy product
prices (+4.2% y/y).
Prices actually
slipped 0.1% last month after 0.1% upticks during January and
December. Nevertheless, food prices still are a firm 4.7% higher than
last year but that's versus a 6.3% comparison this past fall. Recent
weakness has been led by lower dairy product prices (-1.7% y/y) and
five consecutive months of slight decline in meat and dairy product
prices (+4.2% y/y).
Core prices (CPI less food and energy) rose for the second month by 0.2%. Those gains were the strongest since August and moved the year-to-year increase up slightly to 1.8%.
Core goods prices increased a firm 0.4% and that was enough to lift the three-month change to 1.2% (AR), its highest since last August. Prices of new & used motor vehicles rose 0.5% (-2.5% y/y) while apparel prices jumped 1.3% (0.8% y/y). Prices for household furnishings & operations firmed by 0.2% after the slight January decline and the y/y change remained healthy at 1.9%. Tobacco prices again were quite strong and rose 0.7% to leave them up 6.3% y/y.
Gains in core services prices moderated
even further and posted a 0.1% uptick. The three-month rate of increase
remained a low at 1.6% (AR) after growing at a 3.9% rate this past
summer. That moderation owes mostly to weakness in the housing market
which caused February shelter prices to fall slightly. That was enough
to pull the three-month change down to 0.7%. Owners equivalent rent of
primary residence, a measure not equivalent to other house price
measures, ticked up 0.1% (2.1% y/y). 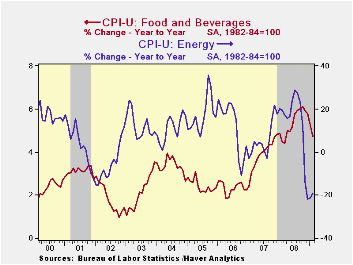 The increase in medical care
services prices fell back to 0.3% (3.1% y/y) while education costs rose
a moderate 0.4% (5.5% y/y). Public transportation prices fell
hard like they did during the prior month by 1.9%. They were down for
the sixth consecutive period (-1.8% y/y). The increase in recreation
prices held firm at 0.4% (1.9% y/y). v The chained CPI, which adjusts
for shifts in consumption patterns, rose 0.6%, about as it did during
January. Less food and energy, chained prices firmed even more and
doubled the January increase of 0.2%.
The increase in medical care
services prices fell back to 0.3% (3.1% y/y) while education costs rose
a moderate 0.4% (5.5% y/y). Public transportation prices fell
hard like they did during the prior month by 1.9%. They were down for
the sixth consecutive period (-1.8% y/y). The increase in recreation
prices held firm at 0.4% (1.9% y/y). v The chained CPI, which adjusts
for shifts in consumption patterns, rose 0.6%, about as it did during
January. Less food and energy, chained prices firmed even more and
doubled the January increase of 0.2%.
The consumer price data is available in Haver's USECON database while detailed figures can be found in the CPIDATA database.
The Impact of Credit Easing So Far from the Federal Reserve Bank of Cleveland is available here.
| Consumer Price Index (%) | February | January | Y/Y | 2008 | 2007 | 2006 |
|---|---|---|---|---|---|---|
| Total | 0.4 | 0.3 | 0.1 | 3.8 | 2.9 | 3.2 |
| Total less Food & Energy | 0.2 | 0.2 | 1.8 | 2.3 | 2.3 | 2.5 |
| Goods less Food & Energy | 0.4 | 0.1 | -0.0 | 0.1 | -0.4 | 0.2 |
| Services less Energy | 0.1 | 0.2 | 2.5 | 3.1 | 3.4 | 3.4 |
| Energy | 3.3 | 1.7 | -19.1 | 13.5 | 5.7 | 11.0 |
| Food & Beverages | -0.1 | 0.1 | 4.7 | 5.4 | 3.9 | 2.3 |
| Chained CPI: Total (NSA) | 0.6 | 0.5 | -0.3 | 3.3 | 2.5 | 2.9 |
| Total less Food & Energy | 0.4 | 0.2 | 1.3 | 2.0 | 2.0 | 2.2 |

Tom Moeller
AuthorMore in Author Profile »Prior to joining Haver Analytics in 2000, Mr. Moeller worked as the Economist at Chancellor Capital Management from 1985 to 1999. There, he developed comprehensive economic forecasts and interpreted economic data for equity and fixed income portfolio managers. Also at Chancellor, Mr. Moeller worked as an equity analyst and was responsible for researching and rating companies in the economically sensitive automobile and housing industries for investment in Chancellor’s equity portfolio. Prior to joining Chancellor, Mr. Moeller was an Economist at Citibank from 1979 to 1984. He also analyzed pricing behavior in the metals industry for the Council on Wage and Price Stability in Washington, D.C. In 1999, Mr. Moeller received the award for most accurate forecast from the Forecasters' Club of New York. From 1990 to 1992 he was President of the New York Association for Business Economists. Mr. Moeller earned an M.B.A. in Finance from Fordham University, where he graduated in 1987. He holds a Bachelor of Arts in Economics from George Washington University.
More Economy in Brief