 Global| Oct 25 2004
Germany's Ifo Index Surprises With a Small Improvement
Summary
Surprisingly the Munich based IFO Institute's index of the business appraisal of the German economic climate improved marginally in October to 95.3 from 95.2 (2000=100) in September. The consensus had predicted a decline to 94.8 and [...]
Surprisingly the Munich based IFO Institute's index of the business appraisal of the German economic climate improved marginally in October to 95.3 from 95.2 (2000=100) in September. The consensus had predicted a decline to 94.8 and the ZEW survey of financial opinion, which frequently anticipates moves in the IFO index, earlier this month had shown a drop of 29.0 points from September to October.
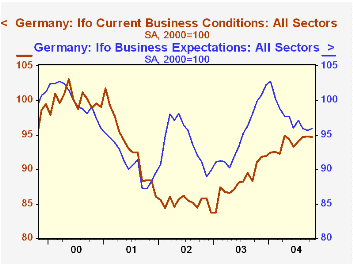
The overall index is the geometric mean of the index of current conditions and the index of expectations of conditions six months hence, both of which are shown in the attached chart. In 2002 and from mid 2003 into early 2004 , expectations have greatly exceeded current conditions. Currently expectations appear to be more in line with current conditions.
The IFO institute publishes its results in both index and percent balance form. However, not all the data are released at the same time. For example, the industrial breakdown on a percent balance basis is available a week or so before that on an index basis. According to the percent balance data, shown in the table below, the business climate in manufacturing, which is the only industry showing positive percent balances, dipped in October to 3.6% from 4.1% in September, but it is still 3.1 percentage points above October of 2003. The percent balance for the economic climate in retail sales was 2.4 percentage points better in October than September.NOTE: The current and expectations indexes are based on the percent balances of respondents to questions concerning their current condition and their expectations of conditions six months hence. The respondents appraise current conditions as "good", "satisfactory" or "poor" and their expectations as "more favorable", "unchanged" or "more unfavorable". The "satisfactory" and "unchanged" categories are considered neutral and the balance is calculated as the difference between the "good" and "poor" in the case of the current conditions balance; and between the "more favorable" and the "more unfavorable" in the case of the expectations balance. These balances are then linked to a base year (2000 currently) and seasonally adjusted. The balance for the climate balance is the geometric mean of the current and expectations indexes.
| Oct 04 | Sep 04 | Oct 03 | M/M % | Y/Y % | 2003 | 2002 | 2001 | |
|---|---|---|---|---|---|---|---|---|
| Business Climate (2000=100) | 95.5 | 95.2 | 95.3 | 0.11 | 0.0 | 91.7 | 89.4 | 92.1 |
| Current Situation | 94.7 | 94.8 | 91.0 | -0.11 | 4.07 | 88.4 | 85.3 | 93.1 |
| Expectations | 95.9 | 95.7 | 99.8 | 0.21 | -3.91 | 95.1 | 93.4 | 91.8 |
| Pt.Dif | Pt.Dif | |||||||
| Business Climate (% Balance) | -10.3 | -10.4 | -10.4 | 0.1 | 0.1 | -17.5 | -22.0 | -16.7 |
| Manufacturing | 3.6 | 4.1 | 0.5 | -0.5 | 3.1 | -7.9 | 10.3 | -10.2 |
| Construction | -45.2 | -45.6 | -45.1 | 0.4 | -0.1 | -42.8 | -44.4 | -38.3 |
| Wholesale trade | -15.6 | -15.3 | -15.2 | -0.4 | -0.4 | -24.0 | -29.8 | -20.8 |
| Retail trade | -28.9 | -31.3 | -17.7 | 2.4 | -11.2 | -25.4 | -40.1 | -20.5 |
More Economy in Brief


