 Global| Mar 11 2003
German Industrial Production Rises
Summary
German industrial production rose 1.65% in January, a turnaround from Decembers sharp decline, and well above the consensus that had anticipated a further decline of 0.5%. Construction continued to be weak and was down 2.63% from [...]
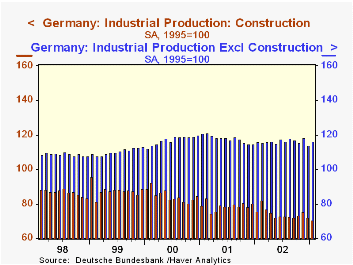
German industrial production rose 1.65% in January, a turnaround from December’s sharp decline, and well above the consensus that had anticipated a further decline of 0.5%.
Construction continued to be weak and was down 2.63% from December and 7% from January of 2002. Excluding construction, industrial activity rose 2% on the month and was slightly above January of 2002. However, it remained below levels reached in the summer and fall of last year.
| German Industrial Production (SA, 1995=100) | Jan03 | Dec02 | Jan02 | M/M%Chg | Y/Y%Chg | 2002 | 2001 | 2000 |
|---|---|---|---|---|---|---|---|---|
| Total | 110.9 | 109.1 | 111.1 | 1.65 | -0.18 | 111.3 | 113.2 | 113.4 |
| Construction | 70.4 | 72.3 | 75.7 | -2.63 | -7.00 | 74.5 | 78.9 | 85.0 |
| Total excl Construction | 116.3 | 114 | 115.9 | 2.02 | 0.35 | 116.2 | 117.8 | 117.2 |
by Louise Curley March 11, 2003
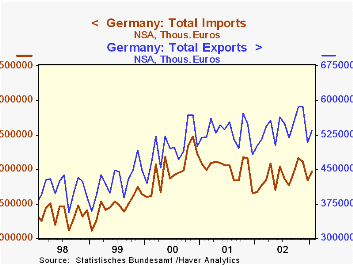
Germany’s balance of trade in goods, on a seasonally unadjusted basis, widened from 8.3 billion euros in December, 2002 to 9.0 billion in January 2003. Exports were up 5.11% and imports, 4.71%. On a seasonally adjusted basis, however, the surplus narrowed from 10.5 billion euros to 10.4 billion.
The euro has been rising steadily since early 2002 and at the end of February, 2003 was almost 25% above February of a year ago. While exports to non-euro areas have kept up so far, the higher euro may begin to have a negative impact on them and thus reduce one of the few positive forces in the German economy. On the import side, the stronger euro should reduce any inflationary pressures and help to offset part of the higher dollar cost of oil.
| German Trade in Goods | Jan03 | Dec02 | Jan02 | M/M%Chg | Y/Y%Chg | 2002 | 2001 | 2000 |
|---|---|---|---|---|---|---|---|---|
| Exports (Bil.Euros, NSA) | 53.5 | 50.9 | 50.1 | 5.11 | 6.79 | 54.0 | 53.0 | 49.8 |
| Imports (Bil.Euros, NSA) | 44.5 | 42.5 | 40.0 | 4.71 | 11.25 | 44.9 | 45.2 | 43.5 |
| Balance of Trade in Goods (Bil.Euros, NSA) | 9.0 | 8.3 | 10.1 | 8.43 | -10.89 | 9.1 | 7.8 | 6.3 |
More Economy in Brief


