 Global| Sep 07 2004
German Industrial Production and New Orders Rise in July
Summary
Industrial production in Germany rose more in July than had been expected. The consensus had expected a rise in German industrial production after the 1.48% decline in June, but the extent of the rise was expected to be less than 1%. [...]
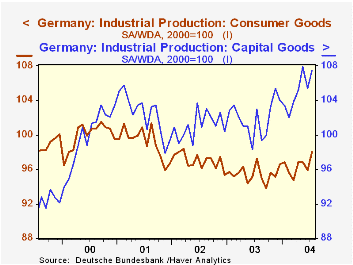
Industrial production in Germany rose more in July than had been expected. The consensus had expected a rise in German industrial production after the 1.48% decline in June, but the extent of the rise was expected to be less than 1%. In fact the index rose 1.60% and is now at the highest level since February, 2001. The manufacturing and mining index rose 1.77%. The output of capital goods rose 1.99%, that of consumer durable, 6.76% and that of consumer nondurable, 1.13%. The first chart shows the output of capital goods and consumer goods. Capital goods output has been strong since mid 2003, while that of consumer goods has, at best, stabilized It is not apparent from the industrial production data to what extent the rise in production was due to domestic or foreign demand.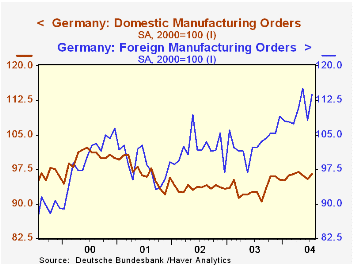
Some indication of the source of demand can be seen in the New Orders data, which include foreign and domestic new orders. Domestic new orders rose 1.05% in July from June and were 3.99% above July 2003. Foreign new orders rose 5.18% in July and were 11.35% above July 2003. The second chart showing foreign and domestic new orders suggests that foreign demand is still the major factor in the rise in German industrial production, but domestic demand is beginning to show a slight improvement.
| 2000=100 | Jul 04 | Jun 04 | Jul 03 | M/M % | Y/Y % | 2003 | 2002 | 2001 |
|---|---|---|---|---|---|---|---|---|
| Industrial Production | ||||||||
| Total | 101.4 | 99.8 | 99.2 | 1.60 | 2.22 | 98.4 | 98.3 | 99.5 |
| Manufacturing and Mining | 103.7 | 101.9 | 100.4 | 1.77 | 3.29 | 99.5 | 99.3 | 100.4 |
| Capital Goods | 107.5 | 105.4 | 103.0 | 1.99 | 4.37 | 102.0 | 101.1 | 102.4 |
| Consumer Durable Goods | 94.8 | 88.8 | 92.4 | 6.76 | 2.60 | 87.1 | 92.0 | 100.6 |
| Consumer Non Durable Goods | 98.7 | 97.6 | 98.3 | 1.13 | 0.41 | 97.4 | 98.2 | 98.8 |
| New Orders (2000 Prices) | ||||||||
| Total | 104.1 | 101.1 | 96.9 | 2.97 | 7.43 | 97.8 | 97.2 | 97.4 |
| Domestic | 96.4 | 95.4 | 92.7 | 1.05 | 3.99 | 93.4 | 93.5 | 96.7 |
| Foreign | 113.8 | 108.2 | 102.2 | 5.18 | 11.35 | 103.3 | 101.9 | 98.4 |
More Economy in Brief


