 Global| Oct 23 2009
FHFA Home Price Index Reverses Monthly Gain While Y/Y Loss Eases
by:Tom Moeller
|in:Economy in Brief
Summary
The decline in home prices continued to moderate according the U.S. House Price Index from the Federal Housing and Finance Agency (FHFA). The Purchase Only Index for August fell 0.3% and reversed its July increase. Nevertheless, the [...]
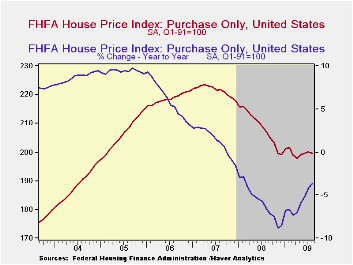 The decline in home prices continued to moderate according the
U.S. House Price Index from the Federal Housing and Finance Agency
(FHFA). The Purchase Only Index for August fell 0.3% and reversed its
July increase. Nevertheless, the year-to-year decline in the nationwide
average of home prices eased to -3.6% from its worst reading of -8.8%
last November. Since their peak in early-2007 home prices nationwide
have fallen 10.7%. The FHFA uses data provided by Fannie Mae and
Freddie Mac and is not value-weighted.
The decline in home prices continued to moderate according the
U.S. House Price Index from the Federal Housing and Finance Agency
(FHFA). The Purchase Only Index for August fell 0.3% and reversed its
July increase. Nevertheless, the year-to-year decline in the nationwide
average of home prices eased to -3.6% from its worst reading of -8.8%
last November. Since their peak in early-2007 home prices nationwide
have fallen 10.7%. The FHFA uses data provided by Fannie Mae and
Freddie Mac and is not value-weighted.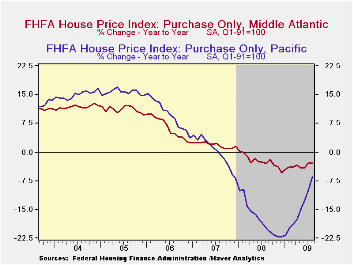
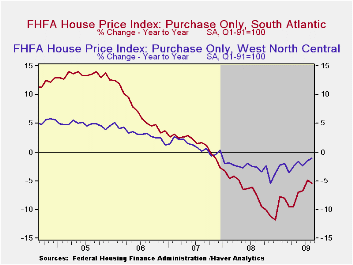
Notable monthly declines in home prices during August were
logged in the South Atlantic and the New England regions of the
country, though the y/y declines have moderated significantly.
Conversely, prices in the Mountain and in the Pacific regions recovered
m/m but remain down the most of the country's regions versus last
August. 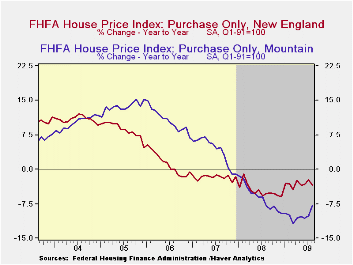 Prices in the Middle Atlantic and in the East North Central
Regions also fell moderately during August but the y/y declines have
moderated significantly this year.
Prices in the Middle Atlantic and in the East North Central
Regions also fell moderately during August but the y/y declines have
moderated significantly this year.
In the populous East North Central region prices slipped another 0.6% during August but they were flat year-to-date. Prices also slipped in the West South Central region but have risen slightly since December.
 Mideast Oil Exporters Face the Crisis Ahead from
the International Monetary Fund can be found here.
Mideast Oil Exporters Face the Crisis Ahead from
the International Monetary Fund can be found here.
| FHFA U.S. House Price Index Purchase Only (%) | August | July | Y/Y | 2008 | 2007 | 2006 |
|---|---|---|---|---|---|---|
| Total | -0.3 | 0.3 | -3.6 | -5.8 | 1.3 | 6.0 |
| New England | -1.1 | -0.1 | -3.4 | -4.6 | -1.7 | 1.1 |
| Middle Atlantic | -0.6 | 0.9 | -2.8 | -2.3 | 1.9 | 6.3 |
| East North Central | -0.6 | -0.1 | -3.4 | -4.4 | -1.3 | 1.8 |
| West North Central | 0.2 | 0.1 | 1.0 | -2.8 | 1.0 | 3.2 |
| South Atlantic | -1.6 | 1.2 | -5.5 | -7.1 | 1.4 | 7.1 |
| East South Central | 0.4 | -1.1 | -0.7 | -1.4 | 3.8 | 7.2 |
| West South Central | -0.0 | -0.6 | 0.4 | 0.7 | 4.7 | 7.2 |
| Mountain | 0.3 | -0.0 | -7.8 | -6.0 | 4.0 | 10.6 |
| Pacific | 1.1 | 0.9 | -6.5 | -17.3 | 0.1 | 9.8 |

Tom Moeller
AuthorMore in Author Profile »Prior to joining Haver Analytics in 2000, Mr. Moeller worked as the Economist at Chancellor Capital Management from 1985 to 1999. There, he developed comprehensive economic forecasts and interpreted economic data for equity and fixed income portfolio managers. Also at Chancellor, Mr. Moeller worked as an equity analyst and was responsible for researching and rating companies in the economically sensitive automobile and housing industries for investment in Chancellor’s equity portfolio. Prior to joining Chancellor, Mr. Moeller was an Economist at Citibank from 1979 to 1984. He also analyzed pricing behavior in the metals industry for the Council on Wage and Price Stability in Washington, D.C. In 1999, Mr. Moeller received the award for most accurate forecast from the Forecasters' Club of New York. From 1990 to 1992 he was President of the New York Association for Business Economists. Mr. Moeller earned an M.B.A. in Finance from Fordham University, where he graduated in 1987. He holds a Bachelor of Arts in Economics from George Washington University.
More Economy in Brief


