 Global| Mar 03 2009
February U.S. Light Vehicle Sales Lower Still
by:Tom Moeller
|in:Economy in Brief
Summary
What can be said about the decline in U.S. vehicle sales that hasn't already been noted? It's been picking up momentum recently. It's been to the lowest level since 1982. It's been broad-based across manufacturers and product type. [...]
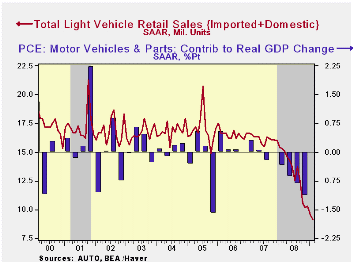
What can be said about the decline in U.S. vehicle sales that hasn't already been noted? It's been picking up momentum recently. It's been to the lowest level since 1982. It's been broad-based across manufacturers and product type. U.S. unit sales of light vehicles fell a surprising 4.7% m/m to 9.12M (SAAR) from 9.57M during January. Sales of 9.6M had been expected for February. The latest figure was the lowest since June of 1982 according to the Autodata Corporation and Ward's Automotive News. (Seasonal adjustment of the figures is provided by the U.S. Bureau of Economic Analysis). The increased downward momentum portion of the story is that the February decline pulled the comparison versus a year ago to -40 6% which was its worst since the data became available in the late 1960s.
Sales of domestically-made light vehicles again were particularly hard hit. They posted a 6.8% month-to-month decline from January to 6.29 million units. That decline came on the heels of January's 12.2% drop. The level is now 45.5% below February 2008. Sales of domestically made light trucks led last month's downdraft with a 13.0% decline to 3.4M units. That was countered to an extent by a 1.7% m/m rise in domestic auto sales, but February's increase followed a 20.8% January decline and they still were off by almost one-half from February 2008.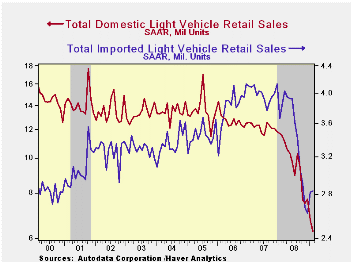
The U.S. vehicle sales figures can be found in Haver's USECON database.
| Light Vehicle Sales (SAAR, Mil. Units) | February | January | December | Feb.'09 / Feb.'08 | 2008 | 2007 | 2006 |
|---|---|---|---|---|---|---|---|
| Total | 9.12 | 9.57 | 10.31 | -40.6% | 13.17 | 16.16 | 16.54 |
| Autos | 4.63 | 4.60 | 5.21 | -37.2 | 6.71 | 7.58 | 7.77 |
| Domestic | 2.89 | 2.84 | 3.59 | -41.7 | 4.42 | 5.07 | 5.31 |
| Imported | 1.74 | 1.76 | 1.62 | -28.1 | 2.29 | 2.52 | 2.45 |
| Light Trucks | 4.50 | 4.97 | 5.10 | -43.7 | 6.47 | 8.60 | 8.78 |
| Domestic | 3.40 | 3.91 | 4.10 | -48.3 | 5.29 | 7.10 | 7.42 |
| Imported | 1.10 | 1.06 | 1.00 | -22.2 | 1.18 | 1.47 | 1.37 |

Tom Moeller
AuthorMore in Author Profile »Prior to joining Haver Analytics in 2000, Mr. Moeller worked as the Economist at Chancellor Capital Management from 1985 to 1999. There, he developed comprehensive economic forecasts and interpreted economic data for equity and fixed income portfolio managers. Also at Chancellor, Mr. Moeller worked as an equity analyst and was responsible for researching and rating companies in the economically sensitive automobile and housing industries for investment in Chancellor’s equity portfolio. Prior to joining Chancellor, Mr. Moeller was an Economist at Citibank from 1979 to 1984. He also analyzed pricing behavior in the metals industry for the Council on Wage and Price Stability in Washington, D.C. In 1999, Mr. Moeller received the award for most accurate forecast from the Forecasters' Club of New York. From 1990 to 1992 he was President of the New York Association for Business Economists. Mr. Moeller earned an M.B.A. in Finance from Fordham University, where he graduated in 1987. He holds a Bachelor of Arts in Economics from George Washington University.
More Economy in Brief


