 Global| Jan 07 2003
Factory Inventories Resumed Decumulation
by:Tom Moeller
|in:Economy in Brief
Summary
Manufacturing inventories fell in November following a slight decline the month prior that initially was reported as no change. The declines follow a brief two months of accumulation. The figures are broadly consistent with the ISM [...]
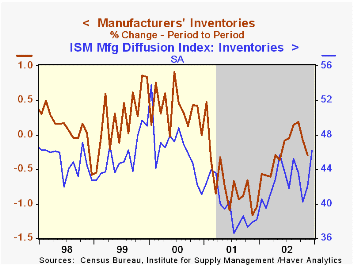
Manufacturing inventories fell in November following a slight decline the month prior that initially was reported as no change. The declines follow a brief two months of accumulation.
The figures are broadly consistent with the ISM survey which indicated that inventories continued to run off, though at a rate slower than early in 2002 and 2001.
Inventory decumulation in November was significant in the transportation sector, but outside of automobiles which have risen for the last three months.
Inventory declines also continued in a broad range of durable goods industries including electrical equipment, machinery, fabricated metals. Inventories of computers and furniture rose.
Nondurable goods inventories fell 0.4% (0.4% y/y) following five months of gain.
For analysis by the Federal Reserve Bank of New York of how inventory dynamics have changed, click here.
Factory shipments fell sharply, nearly reversing all of the prior month's gain. For the year shipments have risen 2.4%. Gains for the year have been dominated by increases in the primary metals and miscellaneous categories.
Factory orders fell 0.8%, slightly more than expectations based on the advance report that durable goods orders fell 1.4%. That decline was revised to -1.5% (1.3% YTD).
| Factory Survey (NAICS) | Nov | Oct | Y/Y | 2001 | 2000 | 1999 |
|---|---|---|---|---|---|---|
| Inventories | -0.3% | -0.1% | -3.6% | -8.0% | 4.5% | 3.1% |
| New Orders | -0.8% | 1.4% | 3.5% | -7.2% | 5.2% | 4.0% |
| Shipments | -0.8% | 1.2% | 2.7% | -5.3% | 4.4% | 3.3% |
by Tom Moeller January 7, 2003
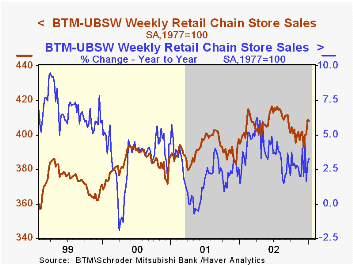
Chain store sales fell during the final week of last year, but gave back just 0.2% of the huge 2.1% gain during Christmas week, according to the BTM-UBSW survey.
December sales rose 0.1% (2.8% y/y) from the November average.
During the last ten years there has been a 48% correlation between the year-to-year percent change in monthly chain store sales and the change in GAF retail sales. That correlation rose to 63% during the last five years.
| BTM-UBSW (SA, 1977=100) | 1/04/03 | 12/28/02 | Y/Y | 2002 | 2001 | 2000 |
|---|---|---|---|---|---|---|
| Total Weekly Retail Chain Store Sales | 408.0 | 409.0 | 3.3% | 3.6% | 2.1% | 3.4% |

Tom Moeller
AuthorMore in Author Profile »Prior to joining Haver Analytics in 2000, Mr. Moeller worked as the Economist at Chancellor Capital Management from 1985 to 1999. There, he developed comprehensive economic forecasts and interpreted economic data for equity and fixed income portfolio managers. Also at Chancellor, Mr. Moeller worked as an equity analyst and was responsible for researching and rating companies in the economically sensitive automobile and housing industries for investment in Chancellor’s equity portfolio. Prior to joining Chancellor, Mr. Moeller was an Economist at Citibank from 1979 to 1984. He also analyzed pricing behavior in the metals industry for the Council on Wage and Price Stability in Washington, D.C. In 1999, Mr. Moeller received the award for most accurate forecast from the Forecasters' Club of New York. From 1990 to 1992 he was President of the New York Association for Business Economists. Mr. Moeller earned an M.B.A. in Finance from Fordham University, where he graduated in 1987. He holds a Bachelor of Arts in Economics from George Washington University.
More Economy in Brief


