 Global| Aug 29 2005
ECRI Leading Index Suggests Economic Growth
by:Tom Moeller
|in:Economy in Brief
Summary
The leading index of the US economy published weekly by the Economic Cycle Research Institute (ECRI) stuttered in the last two periods but failed to reverse the sharp improvement in the measure since the low this past May. Since the [...]
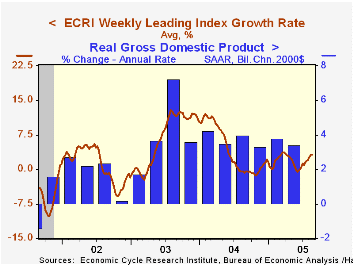
The leading index of the US economy published weekly by the Economic Cycle Research Institute (ECRI) stuttered in the last two periods but failed to reverse the sharp improvement in the measure since the low this past May.
Since the low, growth in the leaders has improved to 3.2% after having been slightly negative for a short period.
During the last ten years there has been a 53% correlation between the change in the weekly leading index and the change in US real GDP growth during the following quarter. The correlation has risen to 72% during the last five years.
"But if recessions have historically been so hard to predict, why should you listen to us?" This quotefrom the book Beating the Business Cycle points out the difficulty of forecasting, especially when it concerns the future.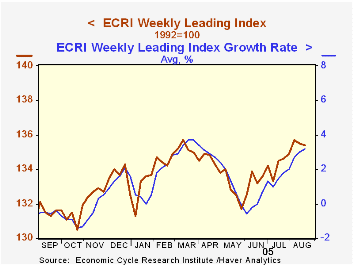
"To monitor just the U.S. economy, ECRI uses an array of 19 specialized leading indexes in the context of an “economic cycle cube” covering various sectors and aspects of the economy."
Visit the Economic Cycle Research Institute for analysis of US and international business cycles.
Fed Chairman Greenspan's closing remarks from the Jackson Hole, Wyoming symposium can be found here.
| Economic Cycle Research Institute | 08/19/05 | 12/31/04 | Y/Y | 2004 | 2003 | 2002 |
|---|---|---|---|---|---|---|
| Weekly Leading Index | 135.4 | 132.5 | 1.4% | 132.6 | 124.9 | 119.8 |
| 6 Month Growth Rate | 3.2% | 1.6% | 4.2% | 6.7% | 1.1% |
by Louise Curley August 29, 2005
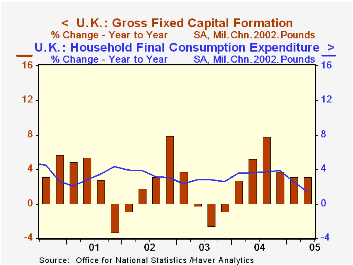
Last Friday, second quarter data for GDP and monthly data for the June Index of Distribution in the United Kingdom were released. The GDP data confirmed the slowdown in growth that has taken place over the past year. Real growth, on a year-over-year basis reached a recent peak of 3.72% in the second quarter of 2004 and has declined in each quarter since then. The deceleration in the domestic sector was even more marked, going from a 4.36% increase in the second quarter of 2004 to one of 1.49% in the second quarter of this year. The first chart shows the year-over-year growth in two major components of domestic demand--household consumption and gross fixed investment. Investment is more volatile than consumption, but both show a marked slowdown in the past year. The rise in exports and decline in imports helped to offset some on the deceleration in the second quarter. The year-over-year changes for the past year and a half in the total and major components of GDP are shown in the table below.
The Index of Distribution, as its name implies, is a broad measure of trade. It includes both wholesale and retail trade and breaks out separately sales of motor vehicles. The total index is shown in the second chart, together with the Index of Industrial Production. The slight rise in the distribution index in contrast to a decline in the industrial production index in June is part of the longer term trends in the two sectors. Production has been declining while distribution has been rising.
The Index of Distribution for the United Kingdom is found in the National Accounts section of the UK data base under the heading Gross Value Added, Chained Volume Indexes, Monthly. In the same location, Industrial Production data are also shown.
| United Kingdom 2002=100 |
Jun 05 | May 05 | Jun 04 | M/M % | Y/Y % | 2004 | 2003 | 2002 |
|---|---|---|---|---|---|---|---|---|
| Index of Distribution | 109.2 | 108.2 | 108.5 | 0.92 | 0.65 | 107.9 | 102.9 | 100.0 |
| Motor Vehicles | 108.4 | 108.4 | 109.9 | 0.00 | -1.36 | 109.3 | 105.9 | 100.0 |
| Wholesale | 106.0 | 105.2 | 104.6 | 0.76 | 1.34 | 104.6 | 100.2 | 100.0 |
| Retail | 112.0 | 110.7 | 111.2 | 1.17 | 0.72 | 110.1 | 103.9 | 100.0 |
| Index of Industrial Production | 99.2 | 99.3 | 101.1 | -0.10 | -1.88 | 100.3 | 95.9 | 100.0 |
| Y/Y % | 2Q O5 | 1Q O5 | 4Q O4 | 3Q O4 | 2Q O4 | 1Q O4 | ||
| Real GDP | 1.77 | 2.13 | 2.71 | 3.08 | 3.72 | 3.43 | ||
| Domestic GDP | 1.49 | 2.61 | 3.01 | 3.52 | 4.36 | 4.06 | ||
| Household Consumption | 1.46 | 2.55 | 3.82 | 3.71 | 3.62 | 3.52 | ||
| Gross Fixed Investment | 3.12 | 3.12 | 3.75 | 7.82 | 5.27 | 2.76 | ||
| Exports | 6.22 | 1.97 | 4.82 | 5.29 | 4.56 | -0.75 | ||
| Imports | 4.78 | 3.72 | 5.82 | 6.83 | 6.98 | 1.96 |

Tom Moeller
AuthorMore in Author Profile »Prior to joining Haver Analytics in 2000, Mr. Moeller worked as the Economist at Chancellor Capital Management from 1985 to 1999. There, he developed comprehensive economic forecasts and interpreted economic data for equity and fixed income portfolio managers. Also at Chancellor, Mr. Moeller worked as an equity analyst and was responsible for researching and rating companies in the economically sensitive automobile and housing industries for investment in Chancellor’s equity portfolio. Prior to joining Chancellor, Mr. Moeller was an Economist at Citibank from 1979 to 1984. He also analyzed pricing behavior in the metals industry for the Council on Wage and Price Stability in Washington, D.C. In 1999, Mr. Moeller received the award for most accurate forecast from the Forecasters' Club of New York. From 1990 to 1992 he was President of the New York Association for Business Economists. Mr. Moeller earned an M.B.A. in Finance from Fordham University, where he graduated in 1987. He holds a Bachelor of Arts in Economics from George Washington University.
More Economy in Brief


