 Global| Oct 31 2006
Economic Sentiment in Europe Continues to Improve
Summary
Economic sentiment in the Eurozone increased 0.9% in October to 110.3 and was 9.9% above October, 2005. For the 25 members of the EU (European Union) the comparable figures were 0,5% 111.5 and 9.9% respectively. The Economic Sentiment [...]
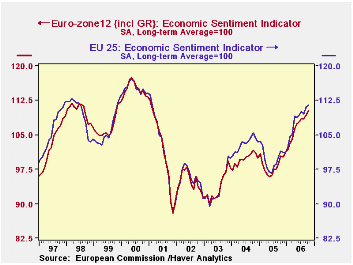
Economic sentiment in the Eurozone increased 0.9% in October to 110.3 and was 9.9% above October, 2005. For the 25 members of the EU (European Union) the comparable figures were 0,5% 111.5 and 9.9% respectively.
The Economic Sentiment Indicator is so designed that 100 represents the long term average. Values above 100 indicate above average sentiment and those below, below average sentiment. The index is a composite of indicators representing industry (40%), service (30%), consumer (20%), construction (5%), and retail (5%). The Euro Zone and EU indicators have been above the long term average since late 2005 and are currently at their highest levels since February, 2001 as can be seen in the first chart.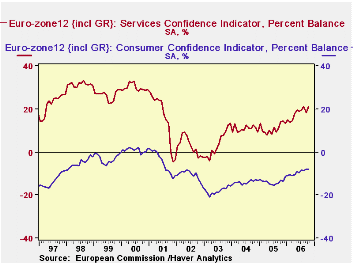
The components of the indicator are expressed in terms of the percent balances between those reporting increases and those reporting decreases. In the Euro Zone, with the exception of construction, all the percent balances of the components increased in October. Sentiment has been highest among those engaged in the service industry and lowest among consumers. In October the percent balance was 20.8% in the service industry while, in the case of the consumer, the percent balance was -7.8%. The second chart contrasts the percent balances in the consumer and service components. Actually the only time the consumer component of the index has shown a positive percent balance during the 21 years that the data have been available was in 2000 and early 2001.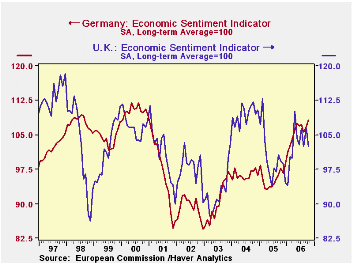
In addition to reporting on the Euro Zone and EU aggregates, the European Commission provides data on each of the countries within the EU. While the Economic Sentiment Indicator for Europe as a whole continued to improve in October, there were diverse trends among the individual countries. In German and France, for example, the indicator rose 1.2% and 1.5% respectively while in Italy and the U. K. the indicators declined 0.6% and 3.8% respectively. The third chart compares the Economic Sentiment Indicators of Germany and of the U.K. Confidence in the U. K. has faltered in recent months while that in Germany has continued to improve.
| Oct 06 | Sep 06 | Oct 05 | M/M % | Y/Y % | 2005 | 2004 | 2003 | |
|---|---|---|---|---|---|---|---|---|
| EURO ZONE | -- | -- | -- | -- | -- | -- | -- | -- |
| Economic Sentiment Indicator (Lt avg =100) |
110.3 | 109.3 | 100.4 | 0.91 | 9.86 | 98.4 | 99.8 | 93.7 |
| Industry (% balance) | 5.2 | 4.4 | -5.7 | 0.8* | 10.9* | -7.3 | -4.7 | -10.3 |
| Service (% balance) | 20.8 | 18.4 | 14.0 | 2.4* | 6.8* | 11.0 | 10.8 | 3.9 |
| Consumer (% balance) | -7.8 | -8.0 | -13.2 | 0.2* | 5.4* | -13.8 | -13.9 | -18.0 |
| Construction (% balance) | 2.5 | 4.1 | -5.0 | -1.6* | 7.5* | -6.8 | -11.8 | -16.0 |
| Retail (% balance) | 3.7 | 3.3 | -5.2 | 0.4* | 8.9* | -7.5 | -8.3 | -9.7 |
| Economic Sentiment Indicator (Lt avg =100) |
-- | -- | -- | -- | -- | -- | -- | -- |
| European Union | 111.5 | 111.0 | 101.5 | 0.45 | 9.85 | 99.9 | 103.0 | 93.8 |
| Germany | 108.1 | 106.8 | 97.7 | 1.22 | 10.64 | 95.6 | 96.3 | 90.6 |
| France | 110.1 | 108.4 | 104.5 | 1.48 | 5.26 | 103.2 | 106.6 | 97.4 |
| Italy | 112.5 | 113.2 | 102.4 | -0.62 | 9.86 | 98.6 | 99.0 | 98.4 |
| United Kingdom | 102.5 | 106.5 | 99.4 | -3.76 | 3.12 | 100.1 | 109.5 | 92.7 |


