 Global| Aug 18 2020
E-Commerce Sales Surge During Lockdown
by:Tom Moeller
|in:Economy in Brief
Summary
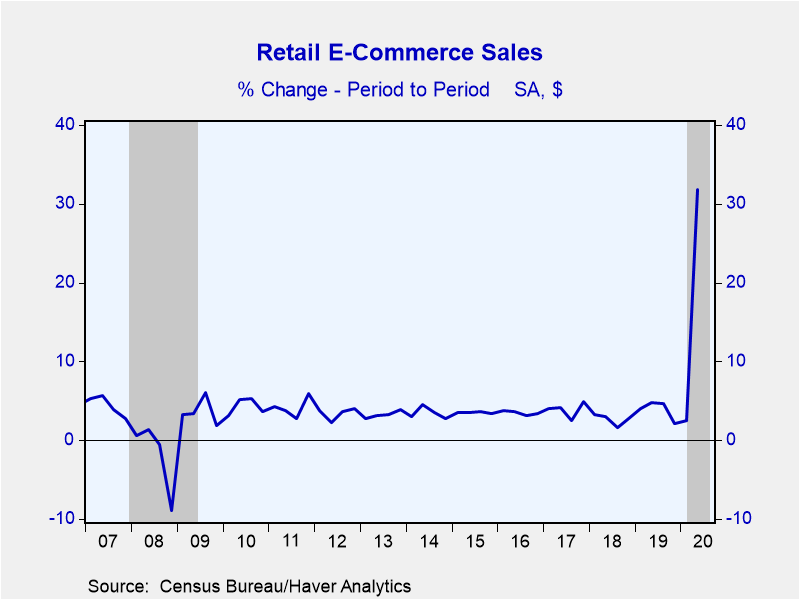
The U.S. Commerce Department reported that during the second quarter of this year, retail sales via the internet (E-Commerce) rose 31.8% (SA) from Q1'20. The gain followed increases of 2.4% in Q1 and a 2.2% Q4'19 rise. This strength [...]
The U.S. Commerce Department reported that during the second quarter of this year, retail sales via the internet (E-Commerce) rose 31.8% (SA) from Q1'20. The gain followed increases of 2.4% in Q1 and a 2.2% Q4'19 rise.
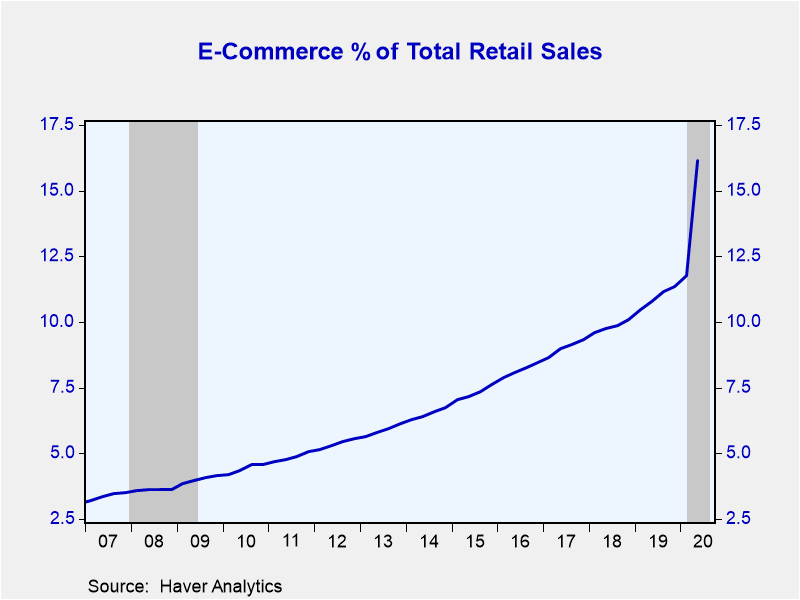
This strength compares to a 3.9% Q2 decline in retail sales overall (-3.6% y/y). As a result, E-Commerce sales rose to 16.1% of total retail sales last quarter, up from 10.9% in 2019 and, by comparison, 4.4% in 2010.
Details of the E-Commerce data are not seasonally adjusted. Compared to last year, these figures show strength in most categories during Q2'20 as a result of stay-at-home mandates. It was led by a 105.3% surge (86.8% y/y) in building materials & garden equipment sales and a 101.4% strengthening (220.5% y/y) in food & beverage purchases. Sales of sporting goods, hobby, musical instruments & books jumped 84.4% (117.8% y/y) while general merchandise purchases strengthened 76.4% (81.8% y/y). Furniture & home furnishing store sales rose 40.4% (61.8% y/y). Nonstore retail sales, which account for 60% of total E-Commerce sales, rose 25.0% (29.6% y/y).
E-commerce sales are sales of goods and services whereby the buyer places an order, or the terms of the sale and price are negotiated over an Internet, mobile device (M-commerce), extranet, Electronic Data Interchange (EDI) network, electronic mail, or other comparable online system. Payment may or may not be made online. Total sales estimates are adjusted for seasonal variation, but not for price changes. They are also adjusted for trading-day differences and moving holidays.
The retail sales and retail E-Commerce sales data can be found in Haver's USECON database.
| Q2'20 | Q1'20 | Q4'19 | Q2'20 Y/Y | 2019 | 2018 | 2017 | ||
|---|---|---|---|---|---|---|---|---|
| Total Retail Sales (%) | -3.9 | -1.2 | 0.5 | -3.6 | 3.4 | 4.2 | 4.6 | |
| % of E-Commerce Sales | ||||||||
| Total E-Commerce Sales (SA) | 100 | 31.8 | 2.4 | 2.2 | 44.5 | 14.9 | 13.4 | 15.5 |
| Total E-Commerce Sales (NSA) | -- | 37.0 | -21.1 | 27.7 | 44.4 | -- | -- | -- |
| Nonstore Retailers (NSA) | 54 | 25.0 | -19.8 | 22.8 | 29.6 | 16.1 | NA | NA |
| Motor Vehicles & Parts | 5 | 14.2 | -11.5 | 1.3 | 7.0 | 9.8 | -- | -- |
| Furniture & Home Furnishings | 2 | 40.4 | -6.7 | 18.6 | 61.8 | 6.8 | -- | -- |
| Building Materials & Garden Equipment | 4 | 105.3 | -6.5 | 7.6 | 86.8 | 11.3 | -- | -- |
| Clothing & Accessories | 7 | 37.8 | -37.0 | 57.8 | 43.6 | 8.7 | -- | -- |
| General Merchandise | 4 | 76.4 | -42.8 | 74.0 | 81.8 | 14.2 | -- | -- |
| Food & Beverages | 4 | 101.4 | 8.5 | 30.1 | 220.5 | 8.7 | -- | -- |
| Sporting Goods, Hobby, Musical Instruments & Books | 2 | 84.4 | -25.7 | 33.6 | 117.8 | -3.4 | -- | -- |
| Miscellaneous (Including Gas Stations) | 3 | 47.7 | -9.3 | 5.5 | 40.8 | 7.2 | -- | -- |
Tom Moeller
AuthorMore in Author Profile »Prior to joining Haver Analytics in 2000, Mr. Moeller worked as the Economist at Chancellor Capital Management from 1985 to 1999. There, he developed comprehensive economic forecasts and interpreted economic data for equity and fixed income portfolio managers. Also at Chancellor, Mr. Moeller worked as an equity analyst and was responsible for researching and rating companies in the economically sensitive automobile and housing industries for investment in Chancellor’s equity portfolio. Prior to joining Chancellor, Mr. Moeller was an Economist at Citibank from 1979 to 1984. He also analyzed pricing behavior in the metals industry for the Council on Wage and Price Stability in Washington, D.C. In 1999, Mr. Moeller received the award for most accurate forecast from the Forecasters' Club of New York. From 1990 to 1992 he was President of the New York Association for Business Economists. Mr. Moeller earned an M.B.A. in Finance from Fordham University, where he graduated in 1987. He holds a Bachelor of Arts in Economics from George Washington University.
More Economy in Brief
 Global| Feb 05 2026
Charts of the Week: Balanced Policy, Resilient Data and AI Narratives
by:Andrew Cates


