 Global| Nov 29 2004
Denmark's GDP Third Quarter Growth Slowed by Decline in the Foreign Trade Balance
Summary
Gross domestic product in Denmark rose a negligible 0.04% in the third quarter. Private consumption rose almost 1% but public consumption fell by 0.6%. Gross fixed capital spending rose 3.6% and a swing in inventory change from a [...]
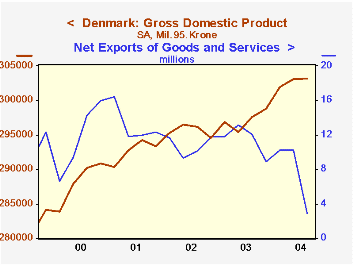
Gross domestic product in Denmark rose a negligible 0.04% in the third quarter. Private consumption rose almost 1% but public consumption fell by 0.6%. Gross fixed capital spending rose 3.6% and a swing in inventory change from a liquidation of 1,051 million 1995 Krone to an accumulation of 3,003 million also added a good boost to output. But the foreign trade sector offset almost all the gains on the domestic sector. The impact of net exports in the total gross national product is illustrated in the first chart.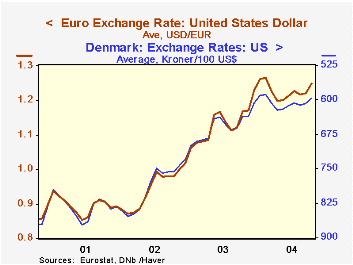
Although Denmark is not in the Euro zone, its currency, the krone has moved with the euro against the dollar as can be seen in the second chart. Part of the decline of 1,7% in the exports of goods and services from the second to the third quarter was due to the rising krone. At the same time, the rising krone stimulated imports of goods and service, which rose by 3.4%. However, rising prices of oil also contributed to the rise in imports. The combination of lower exports and higher imports led to a decline of 7,303 million 1995 krone in the balance of trade in goods and services from 10,224 million 1995 Krone in the second quarter to 2,921 million in the third quarter.
| Millions of 1995 Krone | Q3 04 | Q2 O4 | Q1 04 | Q4 03 | Q3/Q2 % | 2003 | 2002 | 2001 |
|---|---|---|---|---|---|---|---|---|
| Gross domestic product | 303,195 | 303,080 | 301,959 | 298,778 | 0.04 | 1,188,639 | 1,186,639 | 1,170,719 |
| Private consumption | 144,509 | 143,088 | 142,118 | 141,688 | 0.99. | 556,054 | 551,375 | 547,961 |
| Public consumption | 75,864 | 76,327 | 75,186 | 76,351 | -0.61 | 305,077 | 301,922 | 295,601 |
| Gross fixed capital spending | 76,564 | 73,908 | 72,464 | 75,025 | 3.59 | 285,800 | 285,554 | 295,101 |
| Inventory change | 3,003 | -1,051 | 1,888 | -2,433 | 4,054* | -4,225 | 868 | 1,162 |
| Exports of goods and services | 147,319 | 149,838 | 142,218 | 140,475 | -1.68 | 563,819 | 563,885 | 538,315 |
| Imports of goods and services | 144,398 | 139,614 | 131,977 | 131,560 | 3.43 | 517,886 | 520,977 | 485.662 |
| Net exports of goods and services | 2,921 | 10,224 | 10,241 | 8.915 | -7,303* | 45,933 | 42,908 | 52,653 |
More Economy in Brief


