 Global| Aug 23 2004
Deflation in Hong Kong Coming to an End?
Summary
Signs are increasing that the deflation is finally coming to an end in Hong Kong. Consumer prices in July were 0.88% above the year ago figure. This was the first increase since October of 1998. Prices in Hong Kong have fallen ever [...]
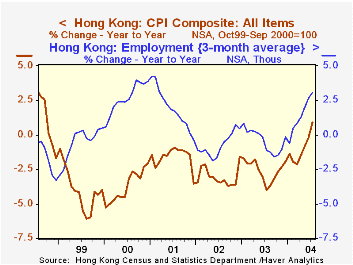
Signs are increasing that the deflation is finally coming to an end in Hong Kong. Consumer prices in July were 0.88% above the year ago figure. This was the first increase since October of 1998. Prices in Hong Kong have fallen ever since the 1997-98 Asian financial crisis which led to a severe recession and collapse of the property market. Deflation was aggravated last year by the SARS (Severe Acute Respiratory Syndrome) outbreak. A low point of 91.0 (October 1999-September 2000 = 100) in the Consumer Price Index was reached in August, 2003.
Price decreases began to decelerate earlier this year as the employment picture improved. The unemployment rate for the three months ending in July was steady at 6.9%, unchanged from the three months rate ending in June. but was 1.7 percentage points below the figure a year ago. Moreover, the three month average of employment ending in July was 0.79% above that ending in June and 2.64% above the year ago figure. Retail sales were down almost one percent in the second quarter of this year from the first quarter but were up almost 19% over the second quarter of last year..
The decline in the unemployment rate and the rise in employment has led to some improvement in demand on the part of domestic consumers, but the big increase in demand has come from the increase in tourism. Tourist arrivals increased 2.88% in the second quarter from the first and 208.44% from the SARS affected first quarter of 2003. Tourist arrivals in the first half of this year were over 10 million, compared with the city's population of 6.8 million.
While some of the increase in July prices may have been due to cost pressures with the rise in oil prices, the evidence suggests that rising demand is beginning to put pressure on prices and an end to deflation is in sight.
| Jul 04 | Jun 04 | Jul 03 | M/M % | Y/Y% | 2003 % | 2002 % | 2001% | |
|---|---|---|---|---|---|---|---|---|
| CPI (NSA, Oct99-Sep00=100) | 91.9 | 91.8 | 91.1 | 0.11 | 0.88 | -2.58 | -3.04 | -1.60 |
| Employment (NSA thous,3-month moving average ending) | 3282.5 | 3256.9 | 3198.1 | 0.79 | 2.64 | -0.34 | -0.64 | 1.40 |
| Unemployment Rate (NSA, %, 3-month moving average ending) | 6.9 | 6.9 | 8.6 | 0.0 | -1.7 | 8.0 | 7.3 | 5.1 |
| Q2 04 | Q1 03 | Q2 03 | Q/Q % | Y/Y % | 2003 % | 2002% | 2001% | |
| Retail Sales (NSA, Oct99-Sep00=100) | 102.4 | 103.2 | 86.1 | -0.78 | 18.89 | -2.26 | -4.08 | -1.23 |
| Tourist Arrivals (NSA Thous.) | 5077.4 | 4935.2 | 1646.2 | 2.88 | 208.44 | -6.21 | 20.70 | 5.10 |
More Economy in Brief


