 Global| Feb 21 2007
CPI Up More Than Expected: Tobacco & Medical Care Strong
by:Tom Moeller
|in:Economy in Brief
Summary
The consumer price index (CPI-U) rose 0.2% last month. The gain was half the 0.4% increase in December but it greatly exceeded Consensus expectations for no change. A firm gain in core prices was behind the strength. Prices less food [...]
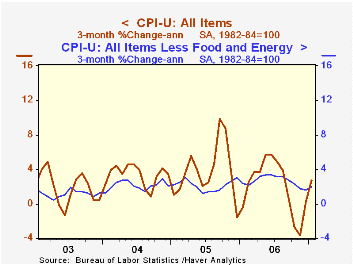
The consumer price index (CPI-U) rose 0.2% last month. The gain was half the 0.4% increase in December but it greatly exceeded Consensus expectations for no change.
A firm gain in core prices was behind the strength. Prices less food & energy rose 0.3% following three consecutive months of 0.1% increase. Consensus expectations had been for a lesser 0.2% increase.
Core goods prices posted a 0.1% (-0.2% y/y) increase which was the firmest gain since August. The rise was powered by a 3.1% (5.5% y/y) spike in tobacco prices. Apparel prices also rose a relatively firm 0.3% (1.0% y/y) which was the strongest gain since September. Many other goods prices, however, fell. Household furnishings & operations prices fell 0.3% (+0.5% y/y). New & used motor vehicles prices fell 0.2% (-1.4% y/y), down for the sixth straight month but medical care commodities rose 0.6% (2.2% y/y).
Core services prices rose 0.3% as shelter prices increased 0.3% (4.3% y/y) for the second month reflecting a mild 0.2% (4.3% y/y) gain in owner's equivalent rent, the weakest monthly increase in a year. Medical services prices jumped 0.9% (4.9% y/y) but education prices increased just 0.1% (5.8% y/y). Prices for public transportation surged 1.5% (0.7% y/y), the most for any one month since 2004.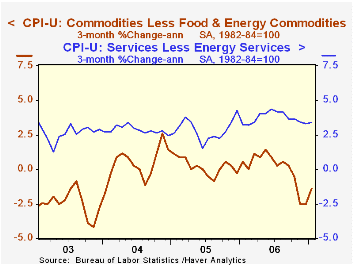
Energy prices fell 1.5% (-2.9% y/y) as gasoline prices slipped 3.0% (-2.7% y/y) and heating oil prices dropped 4.4% (-0.7% y/y). Piped gas & electricity prices, however, rose 0.5% (-3.4% y/y).
Food & beverage prices posted a strong 0.7% increase as dairy & related products surged 1.3% (-0.2% y/y) and meats, poultry & fish rose 0.8%% (2.1% y/y).
The chained CPI, which adjusts for shifts in the mix of consumer purchases, rose 0.3% and the chained "core" rose the same 0.3%.
Milton Friedman on Inflation from the Federal Reserve Bank of St. Louis can be found here.
| Consumer Price Index | January | December | Y/Y | 2006 | 2005 | 2004 |
|---|---|---|---|---|---|---|
| Total | 0.2% | 0.4% | 2.1% | 3.2% | 3.4% | 2.7% |
| Total less Food & Energy | 0.3% | 0.1% | 2.7% | 2.5% | 2.2% | 1.8% |
| Goods less Food & Energy | 0.1% | 0.0% | -0.2% | 0.2% | 0.5% | -0.9% |
| Services less Energy | 0.3% | 0.2% | 3.8% | 3.4% | 2.8% | 2.8% |
| Energy | -1.5% | 4.2% | -2.9% | 11.1% | 16.9% | 10.8% |
| Food & Beverages | 0.7% | -0.1% | 2.4% | 2.3% | 2.4% | 3.4% |
| Chained CPI: Total (NSA) | 0.3% | 0.1% | 1.9% | 2.9% | 2.9% | 2.5% |
| Total less Food & Energy | 0.3% | -0.2% | 2.3% | 2.3% | 1.9% | 1.7% |

Tom Moeller
AuthorMore in Author Profile »Prior to joining Haver Analytics in 2000, Mr. Moeller worked as the Economist at Chancellor Capital Management from 1985 to 1999. There, he developed comprehensive economic forecasts and interpreted economic data for equity and fixed income portfolio managers. Also at Chancellor, Mr. Moeller worked as an equity analyst and was responsible for researching and rating companies in the economically sensitive automobile and housing industries for investment in Chancellor’s equity portfolio. Prior to joining Chancellor, Mr. Moeller was an Economist at Citibank from 1979 to 1984. He also analyzed pricing behavior in the metals industry for the Council on Wage and Price Stability in Washington, D.C. In 1999, Mr. Moeller received the award for most accurate forecast from the Forecasters' Club of New York. From 1990 to 1992 he was President of the New York Association for Business Economists. Mr. Moeller earned an M.B.A. in Finance from Fordham University, where he graduated in 1987. He holds a Bachelor of Arts in Economics from George Washington University.
More Economy in Brief


