 Global| Feb 21 2003
CPI Up Moderately
by:Tom Moeller
|in:Economy in Brief
Summary
The Consumer Price Index (CPI-U) rose as expected last month. Excluding food and energy, prices rose less than Consensus expectations for a 0.2% gain. The core CPI less tobacco rose 0.1% (1.8% y/y). The data reflect annual revisions [...]
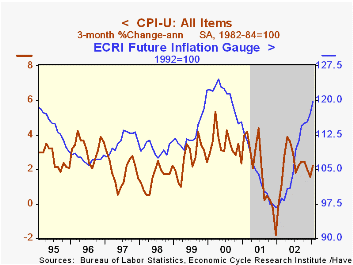
The Consumer Price Index (CPI-U) rose as expected last month. Excluding food and energy, prices rose less than Consensus expectations for a 0.2% gain. The core CPI less tobacco rose 0.1% (1.8% y/y). The data reflect annual revisions to seasonal factors.
Core goods prices fell for the fifth consecutive month. Apparel prices fell 0.9% (-2.0% y/y). New and used vehicle prices fell 0.5% (-2.7% y/y), countering the indication of up car prices in yesterday's PPI report. Prices for household furnishings and operation ticked up 0.2% (-1.0% y/y) for only the third monthly increase since 2001.
Core services prices rose the same 0.3% as in the prior three months. Shelter prices rose 0.3% (3.1% y/y). Medical care services prices rose 0.1% (5.1% y/y) following strong gains during the prior three months.Education and communication prices rose 0.5% (2.3% y/y). Public transportation prices fell 0.6% (-1.8% y/y).
Energy prices were quite strong last month led by a 6.6% (29.2% y/y) increase in gasoline prices (+24.7% y/y). Fuel and utility prices rose 1.4% (3.1% y/y led by a 7.1% (20.9% y/y) gain in fuel oil prices. Piped gas & electricity prices rose 1.5% (2.3% y/y).
Food prices fell for the first month since August led down by lower prices for meat and fruits.
The chained CPI, which correlates closely with the PCE price deflator, rose following two months of decline. The core price measure rose modestly. Shelter prices rose an unadjusted 0.7% (3.0% y/y).
| Consumer Price Index | Jan | Dec | Y/Y | 2002 | 2001 | 2000 |
|---|---|---|---|---|---|---|
| Total | 0.3% | 0.1% | 2.6% | 1.6% | 2.8% | 3.4% |
| Total less Food & Energy | 0.1% | 0.2% | 1.9% | 2.3% | 2.7% | 2.4% |
| Goods less Food & Energy | -0.3% | -0.1% | -1.4% | -1.1% | 0.3% | 0.5% |
| Services less Energy | 0.3% | 0.3% | 3.4% | 3.8% | 3.7% | 3.3% |
| Energy | 4.0% | -0.4% | 14.1% | -5.8% | 3.7% | 16.9% |
| Food & Beverages | -0.2% | 0.2% | 1.0% | 1.8% | 3.1% | 2.3% |
| Chained CPI: Total (NSA) | 0.4% | -0.1% | 2.4% | 1.2% | 2.1% | 2.0% |
| Total less Food & Energy | 0.2% | -0.1% | 1.7% | 1.7% | 1.9% | 1.4% |

Tom Moeller
AuthorMore in Author Profile »Prior to joining Haver Analytics in 2000, Mr. Moeller worked as the Economist at Chancellor Capital Management from 1985 to 1999. There, he developed comprehensive economic forecasts and interpreted economic data for equity and fixed income portfolio managers. Also at Chancellor, Mr. Moeller worked as an equity analyst and was responsible for researching and rating companies in the economically sensitive automobile and housing industries for investment in Chancellor’s equity portfolio. Prior to joining Chancellor, Mr. Moeller was an Economist at Citibank from 1979 to 1984. He also analyzed pricing behavior in the metals industry for the Council on Wage and Price Stability in Washington, D.C. In 1999, Mr. Moeller received the award for most accurate forecast from the Forecasters' Club of New York. From 1990 to 1992 he was President of the New York Association for Business Economists. Mr. Moeller earned an M.B.A. in Finance from Fordham University, where he graduated in 1987. He holds a Bachelor of Arts in Economics from George Washington University.
More Economy in Brief


