 Global| May 17 2006
CPI Up 0.6% Due To Energy & Services
by:Tom Moeller
|in:Economy in Brief
Summary
The April consumer price index (CPI-U) rose 0.6%, the most for any month since a 0.7% rise in January and matched Consensus expectations. For the second month, however, a 0.3% rise in prices less food & energy was firmer than [...]
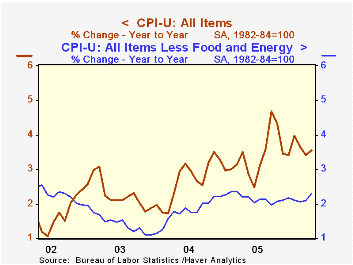
The April consumer price index (CPI-U) rose 0.6%, the most for any month since a 0.7% rise in January and matched Consensus expectations. For the second month, however, a 0.3% rise in prices less food & energy was firmer than expected.
An 8.8% m/m jump in gasoline prices (21.5% y/y) caused energy prices to spike 3.9% and in May gas prices have moved another 6.7% higher to an average $2.93 per gallon. Fuel oil prices also were strong last month and posted a 4.0% (18.6% y/y) gain while natural gas & electricity prices fell 1.5% (+14.1% y/y) for the fourth decline in the last five months.
A 0.3% increase last month in core services prices provided additional lift to last month's rise in the "core" CPI. That reflected a 0.3% (2.9% y/y) rise in shelter prices as well as a 0.5% (6.0% y/y) gain in education expenses. Medical care services prices rose 0.3% (4.1% y/y), the smallest rise in three months and public transportation prices increased for the first month in the last three, by 0.2% (4.8% y/y).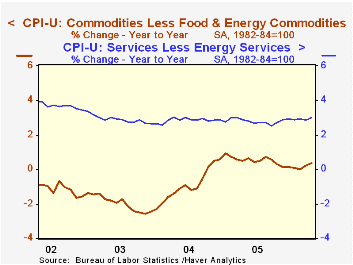
Prices for core goods rose just 0.1% (0.4% y/y), further suggesting that the pass-through of higher energy prices has been limited. Apparel prices did jump 0.6% (-0.2% y/y) following a 1.0% March spike but window & floor coverings prices fell 1.6% (-4.5% y/y) and household appliance prices rose a modest 0.1% (1.3% y/y). New & used motor vehicle prices also rose a slim 0.1% (0.3% y/y) and tobacco prices fell 0.2% +4.2% y/y). Medical care commodity prices rose 0.4% (4.3% y/y).
Food prices were unchanged, an increase held back by a 0.7% (-0.5% y/y) decline in dairy products and another 0.1% decline (+2.6% y/y) drop in fruits & vegetables prices. Meat, fish & poultry prices rose 0.2% (0.5% y/y).
The chained CPI, which adjusts for shifts in the mix of consumer purchases, increased 0.6% and less food & energy prices rose 0.3%, half the prior month's gain.
Gas-Price Inflation from the Federal Reserve Bank of St. Louis can be found here.
| Consumer Price Index | April | Mar | Y/Y | 2005 | 2004 | 2003 |
|---|---|---|---|---|---|---|
| Total | 0.6% | 0.4% | 3.6% | 3.4% | 2.7% | 2.3% |
| Total less Food & Energy | 0.3% | 0.3% | 2.3% | 2.2% | 1.8% | 1.5% |
| Goods less Food & Energy | 0.1% | 0.3% | 0.4% | 0.5% | -0.9% | -2.0% |
| Services less Energy | 0.3% | 0.3% | 3.0% | 2.8% | 2.8% | 2.9% |
| Energy | 3.9% | 1.3% | 17.9% | 16.9% | 10.8% | 12.2% |
| Food | 0.0% | 0.1% | 1.8% | 2.4% | 3.4% | 2.1% |
| Chained CPI: Total (NSA) | 0.6% | 0.5% | 3.1% | 2.9% | 2.5% | 2.0% |
| Total less Food & Energy | 0.3% | 0.6% | 2.1% | 1.9% | 1.7% | 1.1% |

Tom Moeller
AuthorMore in Author Profile »Prior to joining Haver Analytics in 2000, Mr. Moeller worked as the Economist at Chancellor Capital Management from 1985 to 1999. There, he developed comprehensive economic forecasts and interpreted economic data for equity and fixed income portfolio managers. Also at Chancellor, Mr. Moeller worked as an equity analyst and was responsible for researching and rating companies in the economically sensitive automobile and housing industries for investment in Chancellor’s equity portfolio. Prior to joining Chancellor, Mr. Moeller was an Economist at Citibank from 1979 to 1984. He also analyzed pricing behavior in the metals industry for the Council on Wage and Price Stability in Washington, D.C. In 1999, Mr. Moeller received the award for most accurate forecast from the Forecasters' Club of New York. From 1990 to 1992 he was President of the New York Association for Business Economists. Mr. Moeller earned an M.B.A. in Finance from Fordham University, where he graduated in 1987. He holds a Bachelor of Arts in Economics from George Washington University.
More Economy in Brief


