 Global| Dec 16 2009
CPI's 0.4% Gain Is Fueled By Energy; Core Prices Are Unchanged
by:Tom Moeller
|in:Economy in Brief
Summary
Pricing power took on a new dimension last month. Despite higher fuel costs, core prices were unchanged, a result not seen since the depths of the recent recession. The overall November CPI matched Consensus expectations and rose 0.4% [...]
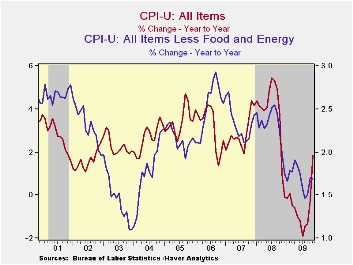 Pricing
power took on a new dimension last month. Despite higher fuel costs,
core prices were unchanged, a result not seen since the depths of the
recent recession. The overall November CPI matched Consensus
expectations and rose 0.4% after an unrevised 0.3% October increase.
Other than energy & food prices, however, consumer prices were
flat. The last time they were unchanged was December of last year when
recessionary forces were gathering steam.
Pricing
power took on a new dimension last month. Despite higher fuel costs,
core prices were unchanged, a result not seen since the depths of the
recent recession. The overall November CPI matched Consensus
expectations and rose 0.4% after an unrevised 0.3% October increase.
Other than energy & food prices, however, consumer prices were
flat. The last time they were unchanged was December of last year when
recessionary forces were gathering steam.
Energy prices jumped 4.1% m/m and have risen 18.7% so far this year. Gasoline prices were quite strong posting a 6.4% (23.6% y/y) increase and rising by more-than-half since December. Fuel oil prices also were firm and rose 7.3% (-7.7% y/y) following a 6.0% gain during October. Finally, prices for natural gas & electricity rose 1.4% (-5.0% y/y) but are down 5.1% this year.
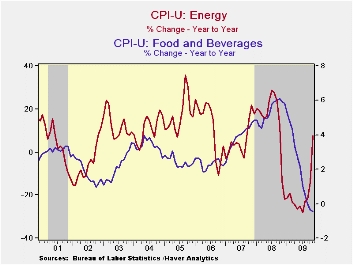 Food
& beverage prices posted another
modest 0.1% uptick. So far this year, food prices have fallen an
unprecedented 0.5%. Recent weakness has been led by lower dairy prices
(-9.0% y/y) and lower fruit & vegetable (-4.9% y/y) costs.
Prices for meats, poultry, fish & eggs also fell 4.0% y/y while
cereals & bakery product prices slipped 0.8%.
Food
& beverage prices posted another
modest 0.1% uptick. So far this year, food prices have fallen an
unprecedented 0.5%. Recent weakness has been led by lower dairy prices
(-9.0% y/y) and lower fruit & vegetable (-4.9% y/y) costs.
Prices for meats, poultry, fish & eggs also fell 4.0% y/y while
cereals & bakery product prices slipped 0.8%.
Consumer prices less food & energy were unchanged following two months of 0.2% increase. A 0.1% November uptick had been expected. The 1.7% y/y gain has been the annual growth rate of core prices all this year. Core services prices continue to feel the recession's effect and slipped slightly last month. Their 1.3% y/y gain was a record low. Weakness in the housing market accounts for much of that moderation. Last month, shelter prices slipped 0.2% and they've risen a minimal 0.2% so far in 2009. Owners equivalent rent of primary residences, a measure not equivalent to other house price measures, slipped for the fourth month in the last five and have risen 0.7% so far this year after a 2.5% increase during 2008. Elsewhere in services, public transportation prices were strong again and posted a 2.6% increase. Recent gains are, however, just making up for declines during the recession. Medical care services prices increased 0.4% (3.5% y/y). Finally, education costs have been firm, up 4.8% y/y after a 5.8% gain during 2008. The annual gain is, however, down from the 6.9% increase during 2004. Recreation prices have really shown the recession's effect and are down 0.2% y/y after a 1.6% 2008 gain.
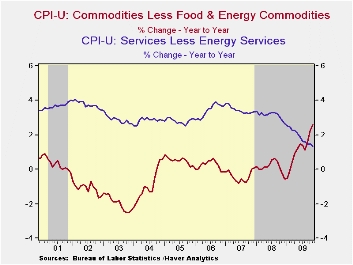 Despite
the weak economy, core goods prices have
been relatively firm and last month increased 0.2%. The increase lifted
prices 2.8% since December following no change during the prior two
years. Higher tobacco prices continued to account for much of the
recent strength and rose 1.0% last month (30.3% y/y). New &
used motor vehicles also have firmed considerably. The 0.8% increase
last month lifted prices by 5.2% since December. That compares with
price deflation during the last two years. Working the other way,
apparel prices fell for the third month in the last four (1.0% y/y.
That follows price declines which extend back to 1994. Continuing weak
were prices for household furnishings & operation. They fell
another 0.3%, leaving them down 1.1% so far this year. · The chained
CPI, which adjusts for shifts in consumption patterns, was unchanged
during November and year-to-year prices rose 1.6%. Conversely, chained
prices less food and energy edged 0.2% lower last month.
Despite
the weak economy, core goods prices have
been relatively firm and last month increased 0.2%. The increase lifted
prices 2.8% since December following no change during the prior two
years. Higher tobacco prices continued to account for much of the
recent strength and rose 1.0% last month (30.3% y/y). New &
used motor vehicles also have firmed considerably. The 0.8% increase
last month lifted prices by 5.2% since December. That compares with
price deflation during the last two years. Working the other way,
apparel prices fell for the third month in the last four (1.0% y/y.
That follows price declines which extend back to 1994. Continuing weak
were prices for household furnishings & operation. They fell
another 0.3%, leaving them down 1.1% so far this year. · The chained
CPI, which adjusts for shifts in consumption patterns, was unchanged
during November and year-to-year prices rose 1.6%. Conversely, chained
prices less food and energy edged 0.2% lower last month.
The consumer price data is available in Haver's USECON database while detailed figures can be found in the CPIDATA database.
| Consumer Price Index (%) | November | October | September | Nov. y/y | 2008 | 2007 | 2006 |
|---|---|---|---|---|---|---|---|
| Total | 0.4 | 0.3 | 0.2 | 1.8 | 3.8 | 2.9 | 3.2 |
| Total less Food & Energy | 0.0 | 0.2 | 0.2 | 1.7 | 2.3 | 2.3 | 2.5 |
| Goods less Food & Energy | 0.2 | 0.4 | 0.3 | 2.6 | 0.1 | -0.4 | 0.2 |
| Services less Energy | -0.0 | 0.1 | 0.1 | 1.3 | 3.1 | 3.4 | 3.4 |
| Energy | 4.1 | 1.5 | 0.6 | 7.7 | 13.5 | 5.7 | 11.0 |
| Food & Beverages | 0.1 | 0.1 | -0.1 | -0.5 | 5.4 | 3.9 | 2.3 |
| Chained CPI: Total (NSA) | 0.0 | 0.1 | 0.1 | 1.6 | 3.3 | 2.5 | 2.9 |
| Total less Food & Energy | -0.2 | 0.3 | 0.2 | 1.3 | 1.9 | 1.9 | 2.2 |

Tom Moeller
AuthorMore in Author Profile »Prior to joining Haver Analytics in 2000, Mr. Moeller worked as the Economist at Chancellor Capital Management from 1985 to 1999. There, he developed comprehensive economic forecasts and interpreted economic data for equity and fixed income portfolio managers. Also at Chancellor, Mr. Moeller worked as an equity analyst and was responsible for researching and rating companies in the economically sensitive automobile and housing industries for investment in Chancellor’s equity portfolio. Prior to joining Chancellor, Mr. Moeller was an Economist at Citibank from 1979 to 1984. He also analyzed pricing behavior in the metals industry for the Council on Wage and Price Stability in Washington, D.C. In 1999, Mr. Moeller received the award for most accurate forecast from the Forecasters' Club of New York. From 1990 to 1992 he was President of the New York Association for Business Economists. Mr. Moeller earned an M.B.A. in Finance from Fordham University, where he graduated in 1987. He holds a Bachelor of Arts in Economics from George Washington University.
More Economy in Brief


