 Global| Oct 18 2002
CPI Rose Moderately
by:Tom Moeller
|in:Economy in Brief
Summary
Consumer prices (CPI-U) rose 0.2% last month, equaling Consensus expectations. Excluding food and energy, prices rose a less than expected 0.1%. Tobacco prices again were strong, rising 1.6% following a 2.4% jump in August. The core [...]
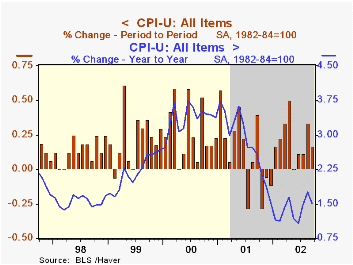
Consumer prices (CPI-U) rose 0.2% last month, equaling Consensus expectations. Excluding food and energy, prices rose a less than expected 0.1%.
Tobacco prices again were strong, rising 1.6% following a 2.4% jump in August. The core CPI less tobacco rose 0.1% (1.9% AR, YTD).
Amongst goods prices weakness was widespread. Household furnishings and operation prices fell 0.2% (-1.5% AR, YTD). Apparel prices rose just 0.1% (-1.2% AR, YTD). New and used vehicle prices also rose just 0.1% (-2.4% AR, YTD).
Services prices weakened after the prior month's spurt. Shelter prices rose just 0.1% (3.3% AR, YTD) after a 0.4% August gain, though the price gain for medical care services doubled to 0.4% (5.1% AR, YTD). Public transportation prices fell 0.9% (-1.3% AR, YTD) for the third decline in four months. Education prices also fell and recreation prices were unchanged.
Energy prices were strong last month led by a 1.0% (30.9% AR, YTD) rise in gasoline prices. Fuel oil prices also were strong, up 1.2%, and piped gas & electricity prices were up 0.4% for the second month.
| Consumer Price Index | Sept | Aug | Y/Y | 2001 | 2000 | 1999 |
|---|---|---|---|---|---|---|
| Total | 0.2% | 0.3% | 1.5% | 2.8% | 3.4% | 2.2% |
| Total less Food & Energy | 0.1% | 0.3% | 2.2% | 2.7% | 2.4% | 2.1% |
| Goods less Food & Energy | 0.0% | 0.2% | -1.1% | 0.3% | 0.5% | 0.7% |
| Services less Energy | 0.1% | 0.4% | 3.6% | 3.7% | 3.3% | 2.7% |
| Energy | 0.7% | 0.6% | -4.9% | 3.7% | 16.9% | 3.6% |
| Food & Beverages | 0.2% | -0.1% | 1.3% | 3.1% | 2.3% | 2.1% |
| Chained CPI: Total (NSA)l | 0.2% | 0.3% | 1.2% | 2.1% | 2.0% | NA |
| Total less Food & Energy | 0.2% | 0.3% | 1.7% | 1.9% | 1.4% | NA |
by Tom Moeller October 18, 2002
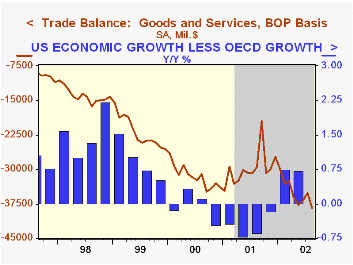
The U.S. foreign trade deficit deepened much more than expected in August to a new record. The previously reported improvement in July was lessened due to lowered exports. Consensus expectations had been for a August deficit of $35.2B
Exports fell (8.6% AR, YTD) and gave back all of the July gain. Capital goods exports fell a sharp 1.5% (8.9% AR, YTD) and nonauto consumer goods exports (-0.3% AR, YTD) also fell sharply.
Imports rose strongly due to a 4.7% surge in industrial supplies & materials (incl. oil). Capital goods imports fell but imports of nonauto consumer goods were strong.
The refiner's acquisition cost of imported crude oil rose to $26.01 in August versus $15.95 in December. Crude oil prices rose further in September and October.
| Foreign Trade | Aug | July | Y/Y | 2001 | 2000 | 1999 |
|---|---|---|---|---|---|---|
| Trade Deficit | $38.5B | $35.1B | $29.5B(8/01) | $358.3B | $378.7B | $262.2B |
| Exports - Goods & Services | -1.3% | 0.9% | -1.5% | -6.2% | 11.2% | 2.6% |
| Imports - Goods & Services | 2.0% | -0.8% | 6.9% | -6.0% | 18.3% | 10.9% |

Tom Moeller
AuthorMore in Author Profile »Prior to joining Haver Analytics in 2000, Mr. Moeller worked as the Economist at Chancellor Capital Management from 1985 to 1999. There, he developed comprehensive economic forecasts and interpreted economic data for equity and fixed income portfolio managers. Also at Chancellor, Mr. Moeller worked as an equity analyst and was responsible for researching and rating companies in the economically sensitive automobile and housing industries for investment in Chancellor’s equity portfolio. Prior to joining Chancellor, Mr. Moeller was an Economist at Citibank from 1979 to 1984. He also analyzed pricing behavior in the metals industry for the Council on Wage and Price Stability in Washington, D.C. In 1999, Mr. Moeller received the award for most accurate forecast from the Forecasters' Club of New York. From 1990 to 1992 he was President of the New York Association for Business Economists. Mr. Moeller earned an M.B.A. in Finance from Fordham University, where he graduated in 1987. He holds a Bachelor of Arts in Economics from George Washington University.
More Economy in Brief


