 Global| Sep 15 2005
CPI Lifted By Strong Energy Prices
by:Tom Moeller
|in:Economy in Brief
Summary
Consumer prices (CPI-U) rose an expected 0.5% last month, the same as the unrevised increase in July. The gain in prices less food & energy prices also has been stable, the same 0.1% for four months. Consensus expectations had been [...]
Consumer prices (CPI-U) rose an expected 0.5% last month, the same as the unrevised increase in July. The gain in prices less food & energy prices also has been stable, the same 0.1% for four months. Consensus expectations had been for a 0.2% increase.
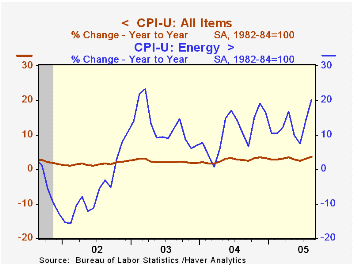
Energy prices added to the prior month's strength and jumped 5.0% led by an 8.3% (31.4% y/y) rise in gasoline prices to an average $2.49 per gallon. In August gasoline prices have risen further to over $3.00 per gallon. Fuel oil prices also rose a strong 2.9% (33.2% y/y increase and natural gas prices rose 1.3% (7.7% y/y).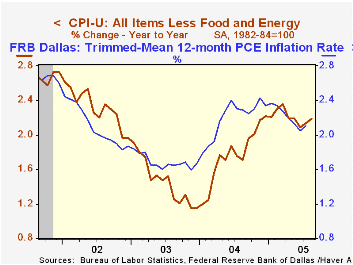
Core goods prices rose 0.1%. This second increase in seven months was led by a 1.0% (-1.6% y/y) rise in apparel prices and a 1.3% (0.2% y/y) gain in audio & equipment. Tobacco prices also rose 0.6% (5.2% y/y). New vehicle prices, down 0.5% (+0.1% y/y), fell hard for the second consecutive month and furniture & bedding prices fell 0.5%(-1.2% y/y).
Core services prices rose a modest 0.1% as shelter prices were unchanged (+2.5% y/y) and as medical care services prices fell slightly (4.5% y/y). Public transportation prices rose just 0.1% (6.5% y/y) and school tuition costs rose 0.2% (6.3% y/y).
The chained CPI which adjusts for shifts in the mix of consumer purchases rose 0.4% and less food & energy chain prices rose 0.2%.
Trimmed Mean PCE Inflation from the Federal Reserve Bank of Dallas can be found here.
Reading Inflation Expectations from CPI Futures from the Federal Reserve Bank of St. Louis is available here.
| Consumer Price Index | Aug | July | Y/Y | 2004 | 2003 | 2002 |
|---|---|---|---|---|---|---|
| Total | 0.5% | 0.5% | 3.6% | 2.7% | 2.3% | 1.6% |
| Total less Food & Energy | 0.1% | 0.1% | 2.2% | 1.8% | 1.5% | 2.3% |
| Goods less Food & Energy | 0.1% | -0.3% | 0.7% | -0.9% | -2.0% | -1.1% |
| Services less Energy | 0.1% | 0.3% | 2.7% | 2.8% | 2.9% | 3.8% |
| Energy | 5.0% | 3.8% | 20.3% | 10.9% | 12.2% | -5.9% |
| Food | 0.0% | 0.2% | 2.2% | 3.4% | 2.1% | 1.8% |
| Chained CPI: Total (NSA) | 0.4% | 0.4% | 3.0% | 2.3% | 2.0% | 1.3% |
| Total less Food & Energy | 0.2% | 0.0% | 1.8% | 1.5% | 1.1% | 1.9% |

Tom Moeller
AuthorMore in Author Profile »Prior to joining Haver Analytics in 2000, Mr. Moeller worked as the Economist at Chancellor Capital Management from 1985 to 1999. There, he developed comprehensive economic forecasts and interpreted economic data for equity and fixed income portfolio managers. Also at Chancellor, Mr. Moeller worked as an equity analyst and was responsible for researching and rating companies in the economically sensitive automobile and housing industries for investment in Chancellor’s equity portfolio. Prior to joining Chancellor, Mr. Moeller was an Economist at Citibank from 1979 to 1984. He also analyzed pricing behavior in the metals industry for the Council on Wage and Price Stability in Washington, D.C. In 1999, Mr. Moeller received the award for most accurate forecast from the Forecasters' Club of New York. From 1990 to 1992 he was President of the New York Association for Business Economists. Mr. Moeller earned an M.B.A. in Finance from Fordham University, where he graduated in 1987. He holds a Bachelor of Arts in Economics from George Washington University.
More Economy in Brief


