 Global| Mar 23 2005
CPI Gain The Strongest Since October
by:Tom Moeller
|in:Economy in Brief
Summary
Consumer Prices (CPI-U) rose 0.4% in February, the strongest monthly increase since October and exceeded Consensus expectations for a 0.3% rise. A 0.3% gain in prices less food & energy also was the firmest since last September and [...]
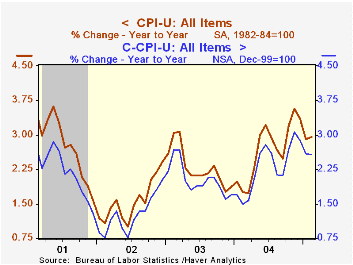
Consumer Prices (CPI-U) rose 0.4% in February, the strongest monthly increase since October and exceeded Consensus expectations for a 0.3% rise.
A 0.3% gain in prices less food & energy also was the firmest since last September and beat expectations for a 0.2% increase.
Services price inflation firmed slightly last month and caused the acceleration. Less energy, services prices rose 0.3% versus 0.2% gains during the prior four months. Shelter price inflation moved slightly higher to 0.3% (3.0% y/y) and medical care services prices ramped to a 0.6% (5.0% y/y) gain after four months at 0.4%. Public transportation prices were unchanged (-1.0% y/y) following two months of decline but school tuition rose 0.5% (6.5% y/y).
Goods prices less energy were unchanged (0.7% y/y) after a 0.3% January gain despite a 0.4% (5.0% y/y) increase in tobacco prices. New vehicle prices rose just 0.1% (1.1% y/y) while apparel prices (0.0% y/y) and furniture prices (0.3% y/y) both fell 0.2%. Personal computer prices also fell 3.6% (NSA, -15.6% y/y).
Energy prices moved up 2.0%. Gasoline prices rose 3.2% (14.7% y/y) last month and so far in March gasoline prices have moved roughly another 10% higher to $2.11 per gallon. Fuel oil prices rose 1.4% (21.5% y/y) and natural gas & electricity prices rose 0.8% (5.1% y/y).
Food prices rose 0.1% for the second month, the gain held back by another decline in fruit & vegetable prices (+2.3% y/y).
The chained CPI which adjusts for shifts in the mix of consumer purchases jumped 0.5%. Core chain prices also rose a strong 0.6%.
| Consumer Price Index | Feb | Jan | Y/Y | 2004 | 2003 | 2002 |
|---|---|---|---|---|---|---|
| Total | 0.4% | 0.1% | 2.9% | 2.7% | 2.3% | 1.6% |
| Total less Food & Energy | 0.3% | 0.2% | 2.3% | 1.8% | 1.5% | 2.3% |
| Goods less Food & Energy | 0.0% | 0.3% | 0.7% | -0.9% | -2.0% | -1.1% |
| Services less Energy | 0.3% | 0.2% | 2.9% | 2.8% | 2.9% | 3.8% |
| Energy | 2.0% | -1.1% | 10.3% | 10.9% | 12.2% | -5.9% |
| Food | 0.1% | 0.1% | 2.6% | 3.4% | 2.1% | 1.8% |
| Chained CPI: Total (NSA) | 0.5% | 0.2% | 2.6% | 2.3% | 2.0% | 1.3% |
| Total less Food & Energy | 0.6% | 0.2% | 2.0% | 1.5% | 1.1% | 1.9% |

Tom Moeller
AuthorMore in Author Profile »Prior to joining Haver Analytics in 2000, Mr. Moeller worked as the Economist at Chancellor Capital Management from 1985 to 1999. There, he developed comprehensive economic forecasts and interpreted economic data for equity and fixed income portfolio managers. Also at Chancellor, Mr. Moeller worked as an equity analyst and was responsible for researching and rating companies in the economically sensitive automobile and housing industries for investment in Chancellor’s equity portfolio. Prior to joining Chancellor, Mr. Moeller was an Economist at Citibank from 1979 to 1984. He also analyzed pricing behavior in the metals industry for the Council on Wage and Price Stability in Washington, D.C. In 1999, Mr. Moeller received the award for most accurate forecast from the Forecasters' Club of New York. From 1990 to 1992 he was President of the New York Association for Business Economists. Mr. Moeller earned an M.B.A. in Finance from Fordham University, where he graduated in 1987. He holds a Bachelor of Arts in Economics from George Washington University.
More Economy in Brief


