 Global| Mar 16 2006
CPI Eased: Energy Prices Lower
by:Tom Moeller
|in:Economy in Brief
Summary
The February consumer price index (CPI-U) rose an expected 0.1% on the heels of the 0.7% spurt during January. Price declines for most fuels dragged energy prices lower by 1.2%. Natural gas prices fell 4.5% (+26.8% y/y) and fuel oil [...]
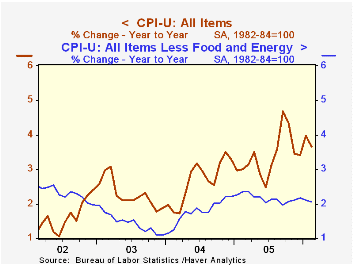
The February consumer price index (CPI-U) rose an expected 0.1% on the heels of the 0.7% spurt during January.
Price declines for most fuels dragged energy prices lower by 1.2%. Natural gas prices fell 4.5% (+26.8% y/y) and fuel oil prices dropped for the fifth straight month, down 2.8% (+24.2% y/y). Gasoline prices fell 1.0% (20.6% y/y) and dented the 6.4% January surge but in March, gasoline prices moved higher to $2.37 per gallon last week from the $2.28 February average.
Prices less food & energy rose a modest 0.1% that was less than the 0.2% Consensus expectation. Prices for core goods fell 0.1% due to a 1.0% (-1.7% y/y) decline in apparel prices and no change (0.5% y/y) in the prices for household furnishings & operation. Medical care commodity prices rose 0.3% (3.8% y/y).
A 0.3% increase in core services prices reflected a 0.4% (2.6% y/y) increase in shelter prices and a 0.5% (4.1% y/y) increase in prices for medical care services prices. School tuition & fees rose 0.3% (6.2% y/y) while public transportation prices fell 0.2% (+7.5% y/y).
Click here for a discussion of Owners Equivalent Rent and the Cost of Living by Federal Reserve Bank of New York economist Charles Steindel. This paper was presented at the Annual Meeting of the National Association for Business Economics (www.nabe.com) and later published in the January 2006 issue of the NABE journal Business Economics.
The gain in the chained CPI, which adjusts for shifts in the mix of consumer purchases, eased to 0.2% but less food & energy prices rose 0.4%.
The Federal Reserve Board's latest Beige Book can be found here.
| Consumer Price Index | Feb | Jan | Y/Y | 2005 | 2004 | 2003 |
|---|---|---|---|---|---|---|
| Total | 0.1% | -0.7% | 2.6% | 3.4% | 2.7% | 2.3% |
| Total less Food & Energy | 0.1% | 0.2% | 2.1% | 2.2% | 1.8% | 1.5% |
| Goods less Food & Energy | -0.1% | 0.2% | 0.0% | 0.5% | -0.9% | -2.0% |
| Services less Energy | 0.3% | 0.2% | 2.9% | 2.8% | 2.8% | 2.9% |
| Energy | -1.2% | 5.0% | 20.1% | 16.9% | 10.9% | 12.2% |
| Food | 0.1% | 0.5% | 2.8% | 2.4% | 3.4% | 2.1% |
| Chained CPI: Total (NSA) | 0.2% | 0.7% | 3.0% | 2.9% | 2.5% | 2.0% |
| Total less Food & Energy | 0.4% | 0.3% | 1.8% | 1.9% | 1.7% | 1.1% |

Tom Moeller
AuthorMore in Author Profile »Prior to joining Haver Analytics in 2000, Mr. Moeller worked as the Economist at Chancellor Capital Management from 1985 to 1999. There, he developed comprehensive economic forecasts and interpreted economic data for equity and fixed income portfolio managers. Also at Chancellor, Mr. Moeller worked as an equity analyst and was responsible for researching and rating companies in the economically sensitive automobile and housing industries for investment in Chancellor’s equity portfolio. Prior to joining Chancellor, Mr. Moeller was an Economist at Citibank from 1979 to 1984. He also analyzed pricing behavior in the metals industry for the Council on Wage and Price Stability in Washington, D.C. In 1999, Mr. Moeller received the award for most accurate forecast from the Forecasters' Club of New York. From 1990 to 1992 he was President of the New York Association for Business Economists. Mr. Moeller earned an M.B.A. in Finance from Fordham University, where he graduated in 1987. He holds a Bachelor of Arts in Economics from George Washington University.
More Economy in Brief


