 Global| Aug 14 2009
CPI Decline Revisits 1950 As Core Price Gain Slows To Smallest Since 2004
by:Tom Moeller
|in:Economy in Brief
Summary
Deflation is much too strong a word to describe all of the pieces of the current pricing environment, but it appropriately denotes the CPI total and some of its components. Last month, the CPI matched Consensus expectations and was [...]
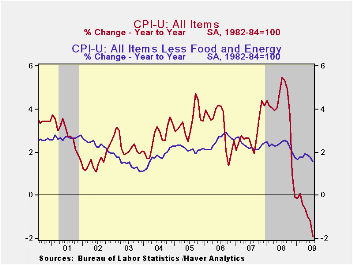 Deflation is
much too strong a word to describe all of the pieces of the current
pricing environment, but it appropriately denotes the CPI total and
some of its components. Last month, the CPI matched Consensus
expectations and was unchanged from June. More to the point, versus
June of last year, the 1.9% decline again was the largest since
early-1950. Stripping out food & energy, prices rose an
expected 0.1% which lessened the y/y gain to 1.6%, its least since
early 2004.
Deflation is
much too strong a word to describe all of the pieces of the current
pricing environment, but it appropriately denotes the CPI total and
some of its components. Last month, the CPI matched Consensus
expectations and was unchanged from June. More to the point, versus
June of last year, the 1.9% decline again was the largest since
early-1950. Stripping out food & energy, prices rose an
expected 0.1% which lessened the y/y gain to 1.6%, its least since
early 2004.
The 0.4% decline in energy prices reversed a small piece of the June jump and left them down by more than one-quarter from the year-ago level. Gasoline prices slipped 0.8% (-37.3% y/y) after a 17.3% jump during June. Fuel oil prices also reversed roughly half of their June rise with a 1.1% (-41.8% y/y) drop. Finally, prices for natural gas & electricity slipped 0.3% (-11.7% y/y).
Food & beverage prices also provided some price relief with a 0.2% decline which was the fifth this year. That lowered the y/y increase to 1.0% which was the lowest since late-2002 and down from the peak 6.1% rate of increase last fall. Recent weakness has been led by lower dairy prices (-9.7% y/y) and lower fruit & vegetable (-3.4% y/y) prices. Prices for meats, poultry & fish also fell by 1.7% y/y while cereals & bakery product prices rose just 1.2%.
The CPI less food & energy also has been well behaved. The expected 0.1% July increase slowed the y/y gain to 1.6% which was its least since early-2004. Of some note, however, is that prices increased at an accelerated 2.1% rate since December of last year. That's only slightly below the 2.3% rates of increase during the last two years.
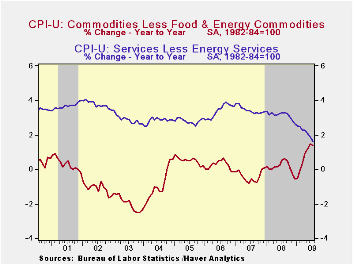 This year, core goods prices indeed
have firmed some. They rose 0.2% last month and at a 3.8% annualized
rate so far this year. That compares with little price change during
the prior three years. Again, higher tobacco prices account for much of
that acceleration. As taxes have been raised, prices jumped 2.2% last
month and so far this year at a 49.8% annual rate. There also has been
modest firming of prices elsewhere. Apparel prices posted a 0.6%
increase and are up at a 3.9% rate this year after price declines which
extend back to 1994 (no typo). Prices for new & used motor
vehicles also seemed to strengthen despite an aggressive marketing
campaign. They rose 0.3% last month and at a 4.1% rate this year. That
compares with price deflation during the last two years. Continuing
weak were prices for household furnishings & operation. They
slipped 0.1% during July and the 0.5% YTD rate of increase about
matches the gain during 2008.
This year, core goods prices indeed
have firmed some. They rose 0.2% last month and at a 3.8% annualized
rate so far this year. That compares with little price change during
the prior three years. Again, higher tobacco prices account for much of
that acceleration. As taxes have been raised, prices jumped 2.2% last
month and so far this year at a 49.8% annual rate. There also has been
modest firming of prices elsewhere. Apparel prices posted a 0.6%
increase and are up at a 3.9% rate this year after price declines which
extend back to 1994 (no typo). Prices for new & used motor
vehicles also seemed to strengthen despite an aggressive marketing
campaign. They rose 0.3% last month and at a 4.1% rate this year. That
compares with price deflation during the last two years. Continuing
weak were prices for household furnishings & operation. They
slipped 0.1% during July and the 0.5% YTD rate of increase about
matches the gain during 2008.
The U.S. recession continued to lower
the strength of core services prices. They were
unchanged last month and have risen at just a 1.5% annual rate so far
this year, half that in 2008 and nearly the weakest since
1983. Weakness in the housing market accounts for much of that
moderation. Last month, shelter prices fell 0.2% and they've risen at a
just a 0.6% annual rate so far in 2009. Owners equivalent rent of
primary residences, a measure not equivalent to other house price
measures, dipped slightly during July and have risen at a 1.6% rate so
far this year versus a 2.5% 2008 increase.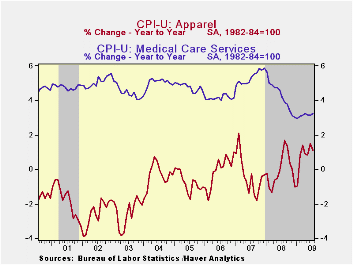 Elsewhere, public
transportation prices posted a 1.9% rebound last month after earlier
declines but they're down at an 8.3% rate this year. Also
firming last month were medical care services prices with a 0.3%
increase and 3.6% YTD gain. Education costs have been firm. They are up
at a 5.5% annual rate this year.
Elsewhere, public
transportation prices posted a 1.9% rebound last month after earlier
declines but they're down at an 8.3% rate this year. Also
firming last month were medical care services prices with a 0.3%
increase and 3.6% YTD gain. Education costs have been firm. They are up
at a 5.5% annual rate this year.
The chained CPI, which adjusts for shifts in consumption patterns, fell 0.2% during July while year-to-year prices fell 1.9%. Chained prices less food and energy were roughly unchanged last month for the third month in a row but the YTD change of 2.2% is up sharply from no change as of the end of last year.
The consumer price data is available in Haver's USECON database while detailed figures can be found in the CPIDATA database.
| Consumer Price Index (%) | July | June | Y/Y | 2008 | 2007 | 2006 | |
|---|---|---|---|---|---|---|---|
| Total | 0.0 | 0.7 | -1.9 | 3.8 | 2.9 | 3.2 | |
| Total less Food & Energy | 0.1 | 0.2 | 1.6 | 2.3 | 2.3 | 2.5 | |
| Goods less Food & Energy | 0.2 | 0.3 | 1.4 | 0.1 | -0.4 | 0.2 | |
| Services less Energy | 0.0 | 0.1 | 1.6 | 3.1 | 3.4 | 3.4 | |
| Energy | -0.4 | 7.4 | -28.0 | 13.5 | 5.7 | 11.0 | |
| Food & Beverages | -0.2 | 0.1 | 1.0 | 5.4 | 3.9 | 2.3 | |
| Chained CPI: Total (NSA) | 0.9 | -1.3 | 3.3 | 2.5 | 2.9 | ||
| Total less Food & Energy | 0.0 | 1.3 | 2.0 | 2.0 | 2.2 | ||

Tom Moeller
AuthorMore in Author Profile »Prior to joining Haver Analytics in 2000, Mr. Moeller worked as the Economist at Chancellor Capital Management from 1985 to 1999. There, he developed comprehensive economic forecasts and interpreted economic data for equity and fixed income portfolio managers. Also at Chancellor, Mr. Moeller worked as an equity analyst and was responsible for researching and rating companies in the economically sensitive automobile and housing industries for investment in Chancellor’s equity portfolio. Prior to joining Chancellor, Mr. Moeller was an Economist at Citibank from 1979 to 1984. He also analyzed pricing behavior in the metals industry for the Council on Wage and Price Stability in Washington, D.C. In 1999, Mr. Moeller received the award for most accurate forecast from the Forecasters' Club of New York. From 1990 to 1992 he was President of the New York Association for Business Economists. Mr. Moeller earned an M.B.A. in Finance from Fordham University, where he graduated in 1987. He holds a Bachelor of Arts in Economics from George Washington University.
More Economy in Brief


