 Global| Nov 16 2006
CPI Again Fell 0.5%, Core Increase Lightest Since February
by:Tom Moeller
|in:Economy in Brief
Summary
The consumer price index (CPI-U) fell 0.5% during October for the second consecutive month and the decline outpaced expectations for a 0.3% drop. Together, the declines were the largest on record. Energy prices about repeated the [...]
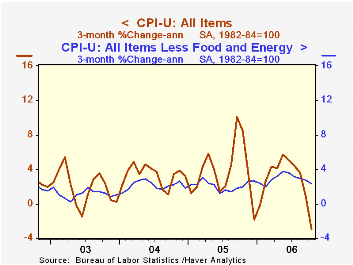
The consumer price index (CPI-U) fell 0.5% during October for the second consecutive month and the decline outpaced expectations for a 0.3% drop. Together, the declines were the largest on record.
Energy prices about repeated the prior month's weakness and fell 7.0% as gasoline prices dropped 11.1% (-18.3% y/y) and fuel oil prices fell 6.1% (-7.7% y/y) for the second month. Gasoline prices have since fallen another 1.3% m/m so far in November to an average $2.22 per gallon. Natural gas prices were down as well by 7.7% (-24.0% y/y) & electricity prices slipped 0.2% (+10.4% y/y).
The 0.1% rise in prices less food & energy was the weakest since a like gain this past February and fell short of Consensus expectations for a 0.2% increase.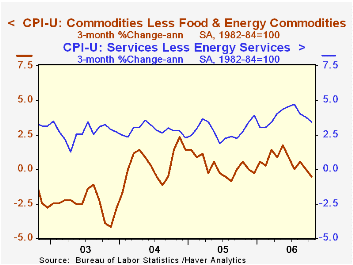
Core goods prices fell 0.3%, down for the third month in the last four. New & used motor vehicle prices fell 0.3% (-0.4% y/y) for the second consecutive month and apparel prices reversed all of their prior month's strength with a 0.7% (+0.6% y/y) decline. Household furnishings & operation prices were unchanged (1,.1% y/y) as were medical care commodity prices (3.3% y/y). Tobacco prices rose 0.1% (2.3 y/y).
Core services prices rose 0.3% for the second month as did shelter prices (4.0% y/y). The rental equivalence measure of owners' primary residences rose 0.4% (4.2% y/y) and rents rose 0.4% (3.9% y/y) for the fifth consecutive month. Public transportation costs fell 1.0% (+1.9% y/y) after a 0.7% September decline but education costs surged 0.6% (6.2% y/y). Medical care services prices rose 0.4% (4.2% y/y) for the third consecutive month.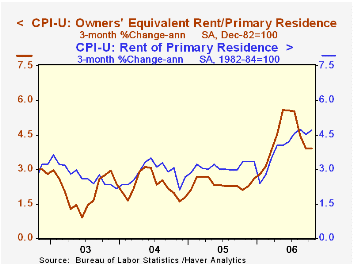
Food & beverage prices rose 0.3% led by a 0.7% jump in dairy prices (-0.3% y/y). Prices for meats, poultry, fish & eggs rose 0.2% (1.9% y/y).
The chained CPI, which adjusts for shifts in the mix of consumer purchases, fell 0.3% for the second month but less food & energy prices rose 0.3% for the second month.
The Minutes to the Latest Meeting of the Federal Open Market Committee can be found here.
| Consumer Price Index | October | September | Y/Y | 2005 | 2004 | 2003 |
|---|---|---|---|---|---|---|
| Total | -0.5% | -0.5% | 1.3% | 3.4% | 2.7% | 2.3% |
| Total less Food & Energy | 0.1% | 0.2% | 2.8% | 2.2% | 1.8% | 1.5% |
| Goods less Food & Energy | -0.3% | 0.1% | 0.2% | 0.5% | -0.9% | -2.0% |
| Services less Energy | 0.3% | 0.3% | 3.8% | 2.8% | 2.8% | 2.9% |
| Energy | -7.0% | -7.2% | -11.2% | 16.9% | 10.8% | 12.2% |
| Food & Beverages | 0.3% | 0.4% | 2.6% | 2.4% | 3.4% | 2.1% |
| Chained CPI: Total (NSA) | -0.3% | -0.3% | 1.6% | 2.9% | 2.5% | 2.0% |
| Total less Food & Energy | 0.3% | 0.3% | 2.5% | 1.9% | 1.7% | 1.1% |

Tom Moeller
AuthorMore in Author Profile »Prior to joining Haver Analytics in 2000, Mr. Moeller worked as the Economist at Chancellor Capital Management from 1985 to 1999. There, he developed comprehensive economic forecasts and interpreted economic data for equity and fixed income portfolio managers. Also at Chancellor, Mr. Moeller worked as an equity analyst and was responsible for researching and rating companies in the economically sensitive automobile and housing industries for investment in Chancellor’s equity portfolio. Prior to joining Chancellor, Mr. Moeller was an Economist at Citibank from 1979 to 1984. He also analyzed pricing behavior in the metals industry for the Council on Wage and Price Stability in Washington, D.C. In 1999, Mr. Moeller received the award for most accurate forecast from the Forecasters' Club of New York. From 1990 to 1992 he was President of the New York Association for Business Economists. Mr. Moeller earned an M.B.A. in Finance from Fordham University, where he graduated in 1987. He holds a Bachelor of Arts in Economics from George Washington University.
More Economy in Brief


