 Global| Sep 13 2005
"Core" PPI Unchanged in August
by:Tom Moeller
|in:Economy in Brief
Summary
The producer price index for finished goods less food & energy, the so called "core" PPI, was unchanged last month versus Consensus expectations for a 0.1% increase and versus a 0.4% gain in July. The overall PPI rose 0.6% in August [...]
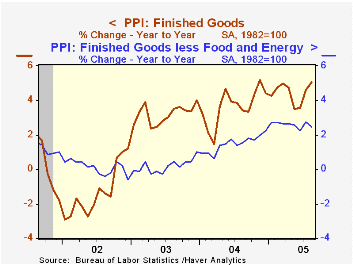
The producer price index for finished goods less food & energy, the so called "core" PPI, was unchanged last month versus Consensus expectations for a 0.1% increase and versus a 0.4% gain in July. The overall PPI rose 0.6% in August and that was below Consensus expectations for a 0.8% increase.
The core PPI is focused on since it provides an indication of the degree to which pressures on energy or food prices may be "spilling over."
Consumer durable goods prices fell 0.1% (+1.3% y/y) led by declines in passenger cars (+0.1% y/y) and appliances (+2.1% y/y). Core consumer nondurable goods prices rose 0.1% (3.7% y/y) while capital goods prices fell 0.1% (2.2% y/y).
Already, the pressure which lifted energy prices 3.7% (19.1% y/y) in August has begun to dissipate. The domestic spot market price of WTI crude oil yesterday fell to $63.35/bbl. from a daily high of $69.82 two weeks ago and an average $64.97 in August. Natural gas prices also have backed off 15% from the daily high but as of yesterday remained up 14% versus the August average.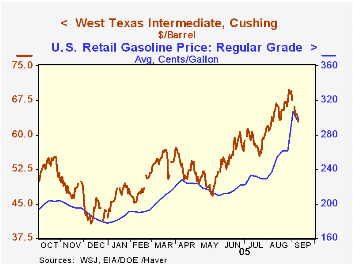
Intermediate goods prices again were strong and rose 0.7% due to a 3.3% rise in energy prices. Core intermediate goods prices, however, declined for the fourth consecutive month.
Crude prices also reflected the strength in energy prices, up 3.8% (28.8% y/y). Core crude prices also were strong for the second straight month reflecting a 22.8% (-26.9% y/y) jump in iron & steel scrap prices and higher prices for aluminum (8.8% y/y) and copper (49.5% y/y) scrap. During the last thirty years "core" crude prices have been a fair indicator of industrial sector activity with a 48% correlation between the six month change in core crude prices and the change in factory sector industrial production.
Hard "Core" Inflation from the Federal Reserve Bank of St. Louis is available here.
| Producer Price Index | Aug | July | Y/Y | 2004 | 2003 | 2002 |
|---|---|---|---|---|---|---|
| Finished Goods | 0.6% | 1.0% | 5.1% | 3.6% | 3.2% | -1.3% |
| Core | 0.0% | 0.4% | 2.5% | 1.5% | 0.2% | 0.1% |
| Intermediate Goods | 0.7% | 1.0% | 6.1% | 6.6% | 4.6% | -1.5% |
| Core | -0.1% | -0.1% | 3.2% | 5.7% | 2.0% | -0.5% |
| Crude Goods | 2.3% | 6.7% | 11.4% | 17.5% | 25.1% | -10.6% |
| Core | 4.6% | 3.1% | -0.1% | 26.6% | 12.4% | 3.8% |

Tom Moeller
AuthorMore in Author Profile »Prior to joining Haver Analytics in 2000, Mr. Moeller worked as the Economist at Chancellor Capital Management from 1985 to 1999. There, he developed comprehensive economic forecasts and interpreted economic data for equity and fixed income portfolio managers. Also at Chancellor, Mr. Moeller worked as an equity analyst and was responsible for researching and rating companies in the economically sensitive automobile and housing industries for investment in Chancellor’s equity portfolio. Prior to joining Chancellor, Mr. Moeller was an Economist at Citibank from 1979 to 1984. He also analyzed pricing behavior in the metals industry for the Council on Wage and Price Stability in Washington, D.C. In 1999, Mr. Moeller received the award for most accurate forecast from the Forecasters' Club of New York. From 1990 to 1992 he was President of the New York Association for Business Economists. Mr. Moeller earned an M.B.A. in Finance from Fordham University, where he graduated in 1987. He holds a Bachelor of Arts in Economics from George Washington University.
More Economy in Brief


