 Global| Dec 17 2004
Consumer Prices Tame, As Expected
by:Tom Moeller
|in:Economy in Brief
Summary
Consumer Prices (CPI-U) were tame last month, rose just 0.2% following the 0.6% spurt in October and were in line with Consensus expectations for a 0.2% rise. Prices less food & energy also were in line with a 0.2% gain that matched [...]
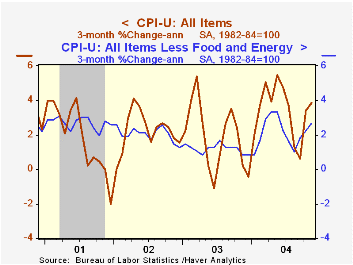
Consumer Prices (CPI-U) were tame last month, rose just 0.2% following the 0.6% spurt in October and were in line with Consensus expectations for a 0.2% rise. Prices less food & energy also were in line with a 0.2% gain that matched the prior months increase.
Services prices less energy rose the same modest 0.2% as in October. Shelter prices rose .05% (2.7% y/y), the weakest for any month in over a year. The rental equivalence price measure was unchanged m/m (2.3% y/y) and prices for lodging away from home fell (+6.1% y/y). Health care services rose 0.3% (5.0% y/y) but tuition & child care costs jumped 0.6% (6.8% y/y). Public transportation prices were strong for the second consecutive month and rose 2.4% (0.3% y/y).
"Core" commodities price inflation eased to 0.1% from the 0.4% strength of October. Household furnishings & operation prices fell (+0.7% y/y) as did prices for used cars & trucks (+3.6% y/y). New motor vehicle prices rose 0.7% (0.3% y/y) and apparel prices ticked 0.1% higher (-0.2% y/y).
Gasoline prices fell 1.8% (+31.0% y/y) but fuel oil prices were strong for seventh consecutive month, up 3.5% (38.3% y/y). Natural gas prices rebounded 2.4% (+6.8% y/y) after two months of decline.
The chained CPI, which adjusts for shifts in the mix of consumer purchases, was unchanged. Similar to the PCE price deflator, core chain prices also were unchanged.
"Are Home Prices the Next Bubble?" from the Federal Reserve Bank of New York can be found here.
| Consumer Price Index | Nov | Oct | Y/Y | 2003 | 2002 | 2001 |
|---|---|---|---|---|---|---|
| Total | 0.2% | 0.6% | 3.6% | 2.3% | 1.6% | 2.8% |
| Total less Food & Energy | 0.2% | 0.2% | 2.2% | 1.5% | 2.3% | 2.7% |
| Goods less Food & Energy | 0.1% | 0.4% | 0.5% | -2.0% | -1.1% | 0.3% |
| Services less Energy | 0.2% | 0.2% | 2.9% | 2.9% | 3.8% | 3.7% |
| Energy | 0.2% | 4.2% | 19.0% | 12.2% | -5.8% | 3.7% |
| Food | 0.2% | 0.6% | 3.2% | 2.1% | 1.8% | 3.1% |
| Chained CPI: Total (NSA) | 0.0% | 0.5% | 3.1% | 1.9% | 1.3% | 2.3% |
| Total less Food & Energy | 0.0% | 0.4% | 1.9% | 1.1% | 1.9% | 2.0% |

Tom Moeller
AuthorMore in Author Profile »Prior to joining Haver Analytics in 2000, Mr. Moeller worked as the Economist at Chancellor Capital Management from 1985 to 1999. There, he developed comprehensive economic forecasts and interpreted economic data for equity and fixed income portfolio managers. Also at Chancellor, Mr. Moeller worked as an equity analyst and was responsible for researching and rating companies in the economically sensitive automobile and housing industries for investment in Chancellor’s equity portfolio. Prior to joining Chancellor, Mr. Moeller was an Economist at Citibank from 1979 to 1984. He also analyzed pricing behavior in the metals industry for the Council on Wage and Price Stability in Washington, D.C. In 1999, Mr. Moeller received the award for most accurate forecast from the Forecasters' Club of New York. From 1990 to 1992 he was President of the New York Association for Business Economists. Mr. Moeller earned an M.B.A. in Finance from Fordham University, where he graduated in 1987. He holds a Bachelor of Arts in Economics from George Washington University.
More Economy in Brief


