 Global| Jul 14 2005
Consumer Prices Rose Less Than Expected
by:Tom Moeller
|in:Economy in Brief
Summary
The CPI-U was unchanged last month following a 0.1% decline in May. The figure was below Consensus expectations for a 0.2% increase in June. During the first half of 2005 the CPI rose 3.1% at an annual rate. Energy prices fell 0.5% [...]
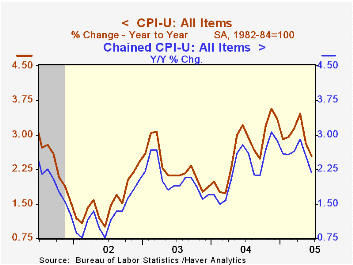
The CPI-U was unchanged last month following a 0.1% decline in May. The figure was below Consensus expectations for a 0.2% increase in June. During the first half of 2005 the CPI rose 3.1% at an annual rate.
Energy prices fell 0.5% led by a 1.2% drop in gasoline prices but gas prices so far in July have more than reversed recent months' declines, rising 5.6% to an average $2.28 per gallon and $2.33 in the latest week. Food prices rose a modest 0.1% for the second month.
Less food & energy prices rose the same 0.1% as in May and during the first six months of this year the core CPI is up 2.2% at an annual rate. Consensus expectations had been for a 0.2% increase in June.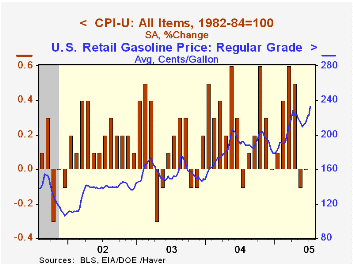
Core goods prices fell for the second month in the last three. The 0.2% decline was led by a 1.3% (-2.8% y/y) drop in furniture & bedding prices and no change (+1.5% y/y) in appliance prices. Apparel prices also fell by 0.7% (-1.5% y/y) and are down 1.0% (AR) so far this year. New motor vehicle prices were unchanged (0.7% y/y) but prices for used cars & trucks rose 0.8% (7.1% y/y).
Core services prices rose a modest 0.2%. Shelter prices rose 0.2% (2.4% y/y) after two months of no change and medical care services prices rose 0.2% (4.8% y/y), the least for any month since April 2003. Public transportation prices were strong for the fourth consecutive month, up 1.2% (4.7% y/y) and school tuition costs rose 0.4% (6.6% y/y).
The chained CPI which adjusts for shifts in the mix of consumer purchases fell 0.1% and less food & energy chain prices fell for the second consecutive month.
| Consumer Price Index | June | May | Y/Y | 2004 | 2003 | 2002 |
|---|---|---|---|---|---|---|
| Total | 0.0% | -0.1% | 2.5% | 2.7% | 2.3% | 1.6% |
| Total less Food & Energy | 0.1% | 0.1% | 2.1% | 1.8% | 1.5% | 2.3% |
| Goods less Food & Energy | -0.2% | 0.2% | 0.5% | -0.9% | -2.0% | -1.1% |
| Services less Energy | 0.2% | 0.1% | 2.7% | 2.8% | 2.9% | 3.8% |
| Energy | -0.5% | -2.0% | 7.4% | 10.9% | 12.2% | -5.9% |
| Food | 0.1% | 0.1% | 2.3% | 3.4% | 2.1% | 1.8% |
| Chained CPI: Total (NSA) | -0.1% | 0.0% | 2.2% | 2.3% | 2.0% | 1.3% |
| Total less Food & Energy | -0.2% | -0.1% | 1.8% | 1.5% | 1.1% | 1.9% |

Tom Moeller
AuthorMore in Author Profile »Prior to joining Haver Analytics in 2000, Mr. Moeller worked as the Economist at Chancellor Capital Management from 1985 to 1999. There, he developed comprehensive economic forecasts and interpreted economic data for equity and fixed income portfolio managers. Also at Chancellor, Mr. Moeller worked as an equity analyst and was responsible for researching and rating companies in the economically sensitive automobile and housing industries for investment in Chancellor’s equity portfolio. Prior to joining Chancellor, Mr. Moeller was an Economist at Citibank from 1979 to 1984. He also analyzed pricing behavior in the metals industry for the Council on Wage and Price Stability in Washington, D.C. In 1999, Mr. Moeller received the award for most accurate forecast from the Forecasters' Club of New York. From 1990 to 1992 he was President of the New York Association for Business Economists. Mr. Moeller earned an M.B.A. in Finance from Fordham University, where he graduated in 1987. He holds a Bachelor of Arts in Economics from George Washington University.
More Economy in Brief


