 Global| Feb 23 2005
Consumer Prices Rose As Expected
by:Tom Moeller
|in:Economy in Brief
Summary
Consumer Prices (CPI-U) rose a modest 0.1% in January following an upwardly revised no change the month earlier. Consensus expectations had been for a 0.2% increase for last month. Prices less food & energy rose the same 0.2% in [...]
Consumer Prices (CPI-U) rose a modest 0.1% in January following an upwardly revised no change the month earlier. Consensus expectations had been for a 0.2% increase for last month.
Prices less food & energy rose the same 0.2% in January as during the prior three months and the gain matched expectations
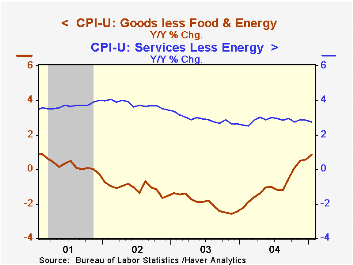
"Core" commodities prices posted a 0.3% increase, one of the larger increases of the last three years, led by a 1.9% (4.4% y/y) spurt in tobacco prices and a 0.7% (1.3% y/y) gain in new vehicle prices. Apparel prices rose 0.3% (+0.2% y/y) and furniture prices rose 0.1% (0.6% y/y). Personal computer prices rose 0.7% (NSA, -13.6% y/y).
Services prices less energy rose 0.2% for the fourth consecutive month. Shelter prices rose a stable 0.2% (2.7% y/y), medical care services inflation also was stable at a firm 0.4% (5.0% y/y) but public transportation prices fell for the second consecutive month (-1.0% y/y). School tuition rose 0.3% (6.5% y/y).
Energy prices fell for the second consecutive month, pulled lower by a 2.1% (+14.3% y/y) decline in gasoline prices. In February gasoline prices are 4.0% higher than in January and have reversed about half of the decline since November. Fuel oil prices fell 4.9% last month (+20.9% y/y) and natural gas & electricity prices rose 0.1% (+5.9% y/y).
Food prices rose 0.1%, the gain held back by a 4.6% drop (+4.6% y/y) in fruit & vegetable prices.
The chained CPI, which adjusts for shifts in the mix of consumer purchases, rose 0.2% and offset the revised 0.2% December decline. Core chain prices rose for the first time since October.
Real Effects of Inflation Through the Redistribution of Nominal Wealth from the Federal Reserve Bank of Minneapolis can be found here.
| Consumer Price Index | Jan | Dec | Y/Y | 2004 | 2003 | 2002 |
|---|---|---|---|---|---|---|
| Total | 0.1% | 0.0% | 2.9% | 2.7% | 2.3% | 1.6% |
| Total less Food & Energy | 0.2% | 0.2% | 2.2% | 1.8% | 1.5% | 2.3% |
| Goods less Food & Energy | 0.3% | 0.0% | 0.9% | -0.9% | -2.0% | -1.1% |
| Services less Energy | 0.2% | 0.2% | 2.8% | 2.8% | 2.9% | 3.8% |
| Energy | -1.1% | -1.3% | 10.5% | 10.9% | 12.2% | -5.9% |
| Food | 0.1% | 0.0% | 2.8% | 3.4% | 2.1% | 1.8% |
| Chained CPI: Total (NSA) | 0.2% | -0.2% | 2.8% | 2.2% | 1.9% | 1.3% |
| Total less Food & Energy | 0.2% | -0.1% | 2.1% | 1.4% | 1.1% | 1.9% |

Tom Moeller
AuthorMore in Author Profile »Prior to joining Haver Analytics in 2000, Mr. Moeller worked as the Economist at Chancellor Capital Management from 1985 to 1999. There, he developed comprehensive economic forecasts and interpreted economic data for equity and fixed income portfolio managers. Also at Chancellor, Mr. Moeller worked as an equity analyst and was responsible for researching and rating companies in the economically sensitive automobile and housing industries for investment in Chancellor’s equity portfolio. Prior to joining Chancellor, Mr. Moeller was an Economist at Citibank from 1979 to 1984. He also analyzed pricing behavior in the metals industry for the Council on Wage and Price Stability in Washington, D.C. In 1999, Mr. Moeller received the award for most accurate forecast from the Forecasters' Club of New York. From 1990 to 1992 he was President of the New York Association for Business Economists. Mr. Moeller earned an M.B.A. in Finance from Fordham University, where he graduated in 1987. He holds a Bachelor of Arts in Economics from George Washington University.
More Economy in Brief


