 Global| Apr 14 2004
Consumer Prices Lifted By Shelter Costs
by:Tom Moeller
|in:Economy in Brief
Summary
The Consumer Price Index (CPI-U) jumped 0.5% in March versus Consensus expectations for a 0.3% gain. Core consumer prices also rose a strong 0.4%, twice the Consensus expectation. A 0.6% (2.6% y/y) surge in shelter costs, which [...]
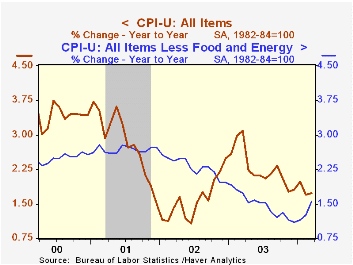
The Consumer Price Index (CPI-U) jumped 0.5% in March versus Consensus expectations for a 0.3% gain. Core consumer prices also rose a strong 0.4%, twice the Consensus expectation.
A 0.6% (2.6% y/y) surge in shelter costs, which accounts for 33% of the CPI, was the strongest since January 1991 and lifted core services prices by 0.5%.
Other service prices were strong. Prices for medical care services again rose 0.7% (5.2% y/y) and public transportation prices rose 0.3% (+1.9% y/y), the strongest monthly gain since October. Tuition costs also rose a strong 0.6% (7.5% y/y).
Prices of core consumer goods edged up just 0.1% despite a 0.9% (-0.2% y/y) spike in apparel prices. New & used vehicle prices fell 0.2% (-4.0% y/y) and prices for home furnishings & operation slid 0.2% (-1.2% y/y). Medical care commodities rose a moderate 0.2% (2.3% y/y).
Energy prices again were firm, up 1.9%. Gasoline prices rose 5.5% (+1.6% y/y) and are up another 2.7% so far in April. Fuel oil prices fell 1.8% (-9.8% y/y) and piped gas prices fell 1.4%% (0.0% y/y).
Food prices again rose 0.2% reflecting higher prices (+0.5%) for cereal & bakery products.
The chained CPI which adjusts for shifts in consumer buying behavior surged 0.6%. It is similar to the PCE price deflator. The core chain price measure jumped 0.7%, a record gain for this series which dates only to 2000.
"Does Inflation Targeting Make A Difference?" from the Federal Reserve Bank of St. Louis can be found here.
| Consumer Price Index | Mar | Feb | Y/Y | 2003 | 2002 | 2001 |
|---|---|---|---|---|---|---|
| Total | 0.5% | 0.3% | 1.7% | 2.3% | 1.6% | 2.8% |
| Total less Food & Energy | 0.4% | 0.2% | 1.6% | 1.5% | 2.3% | 2.7% |
| Goods less Food & Energy | 0.1% | 0.2% | -1.6% | -2.0% | -1.1% | 0.3% |
| Services less Energy | 0.5% | 0.1% | 2.9% | 2.9% | 3.8% | 3.7% |
| Energy | 1.9% | 1.7% | 0.4% | 12.2% | -5.8% | 3.7% |
| Food | 0.2% | 0.2% | 3.2% | 2.1% | 1.8% | 3.1% |
| Chained CPI: Total (NSA) | 0.6% | 0.6% | 1.4% | 1.9% | 1.3% | 2.3% |
| Total less Food & Energy | 0.7% | 0.5% | 1.2% | 1.1% | 1.9% | 2.0% |
by Tom Moeller April 14, 2004
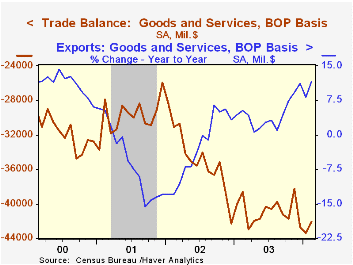
The U.S. foreign trade deficit eased to $42.1B in February from the upward revised record $43.5B of a month earlier. Consensus expectations had been for a deficit of $42.3B.
In the first two months of 1Q04 the deficit averaged $42.8B versus $40.9B in 4Q03.
Exports surged 4.0% in February as exports of capital goods ballooned 5.9% (+13.4% y/y). Non-auto consumer goods exports also rose a strong 4.2% (15.5% y/y). Each category of exports registered a strong m/m gain.
Imports rose a moderate 1.6% and the gain was led by a 7.4% jump in imports of industrial supplies & materials. Imports of petroleum & coal products rose 5.7% as the per barrel price of crude oil rose 2.2% to $29.17. Capital goods imports fell 2.9% (+12.6% y/y) and imports of non-auto consumer goods also were down 2.1% (+6.5% y/y).
By country, the US trade deficit with China eased to $8.3B ($123.9B in 2003) but the US trade deficit with Japan deepened to $6.1B ($66.0B in 2003). The deficit with the European Union deepened to $7.4B after falling to a low $5.9B in January ($94.3B in 2003).
| Foreign Trade | Feb | Jan | Y/Y | 2003 | 2002 | 2001 |
|---|---|---|---|---|---|---|
| Trade Deficit | $42.1B | $43.5B | $38.6B(2/03) | $489.9 | $418.0B | $357.8B |
| Exports - Goods & Services | 4.0% | -1.4% | 11.7% | 4.6% | -3.3% | -5.8% |
| Imports - Goods & Services | 1.6% | -0.4% | 10.9% | 8.4% | 2.0% | -5.5% |
by Tom Moeller April 14, 2004
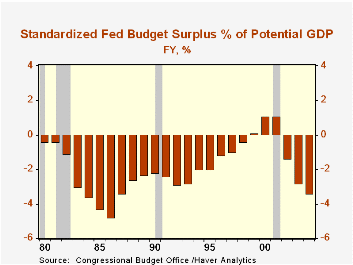
The U.S. Government budget deficit eased to 72.7B in March, about as expected. For the first six months of FY04 the deficit of $299.5B was 18% larger than last year.
So far this fiscal year the deficit is running 5.3% of US GDP versus 3.5% last year and a peak of 6.0% in 1983. Adjusted for economic and other fluctuations, the standardized budget deficit is projected to hit 3.4% this year versus 2.8% last year and a peak of 4.8% in 1986.
Net receipts for the first six months of FY04 improved 3.1% versus the first six months of FY03. The gain reflected a 51.1% rise in corporate tax receipts but the y/y decline in individual tax receipts eased to -1.2%. Contributions for social insurance, estate taxes, and miscellaneous taxes rose.
Federal net expenditures rose 6.6% versus the first six months of last fiscal year. Defense expenditures surged 17.2% and Medicare outlays grew 6.6%. Interest expense fell 4.1% y/y.
"Budget Deficits and Interest Rates" from the Federal Reserve Bank of St. Louis can be found here.
| US Government Finance | Mar | Feb | Mar '03 | FY2003 | FY2002 | FY2001 |
|---|---|---|---|---|---|---|
| Budget Balance | $-72.7B | $-96.7B | $-58.9B | $-374.2B | $-157.8B | $127.3B |
| Revenues | $140.0B | $85.3B | 16.4% | -3.8% | -6.9% | -1.7% |
| Outlays | $212.7B | $182.0B | 18.7% | 7.2% | 7.9% | 4.2% |
by Tom Moeller April 14, 2004
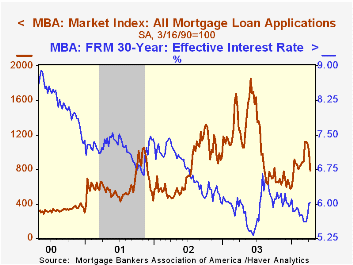
The index of mortgage applications compiled by the Mortgage Bankers Association plunged 22.1% last week following steep declines the prior two weeks.
Applications to refinance fell 30.7% (-48.4% y/y), double the decline of the prior week.
The effective interest rate on a conventional 30-Year mortgage rose to 6.03% from 6.01% the week prior, but that's up from 5.65% averaged in March. The effective rate on a 15-year mortgage rose to 5.45%.
Purchase applications dropped 9.5% w/w (+14.9% y/y) and so far in April are 2.6% ahead of the March average.
During the last ten years there has been a 56% correlation between the y/y change in purchase applications and the change in new plus existing home sales.
The Mortgage Bankers Association surveys between 20 to 35 of the top lenders in the U.S. housing industry to derive its refinance, purchase and market indexes. The weekly survey accounts for more than 40% of all applications processed each week by mortgage lenders. Visit the Mortgage Bankers Association site here.
| MBA Mortgage Applications (3/16/90=100) | 04/09/04 | 04/02/04 | 2003 | 2002 | 2001 |
|---|---|---|---|---|---|
| Total Market Index | 788.6 | 1,012.9 | 1,067.9 | 799.7 | 625.6 |
| Purchase | 432.2 | 477.5 | 395.1 | 354.7 | 304.9 |
| Refinancing | 2,861.6 | 4,126.7 | 4,981.8 | 3,388.0 | 2,491.0 |

Tom Moeller
AuthorMore in Author Profile »Prior to joining Haver Analytics in 2000, Mr. Moeller worked as the Economist at Chancellor Capital Management from 1985 to 1999. There, he developed comprehensive economic forecasts and interpreted economic data for equity and fixed income portfolio managers. Also at Chancellor, Mr. Moeller worked as an equity analyst and was responsible for researching and rating companies in the economically sensitive automobile and housing industries for investment in Chancellor’s equity portfolio. Prior to joining Chancellor, Mr. Moeller was an Economist at Citibank from 1979 to 1984. He also analyzed pricing behavior in the metals industry for the Council on Wage and Price Stability in Washington, D.C. In 1999, Mr. Moeller received the award for most accurate forecast from the Forecasters' Club of New York. From 1990 to 1992 he was President of the New York Association for Business Economists. Mr. Moeller earned an M.B.A. in Finance from Fordham University, where he graduated in 1987. He holds a Bachelor of Arts in Economics from George Washington University.
More Economy in Brief


