 Global| Feb 20 2004
Consumer Prices Boosted by Energy, Core Tame
by:Tom Moeller
|in:Economy in Brief
Summary
The Consumer Price Index (CPI-U) rose 0.5% in January versus the Consensus expectation for a 0.3% gain. Less food & energy prices rose 0.2%, slightly firmer than the 0.1% Consensus expectation. Rising energy prices were the source of [...]
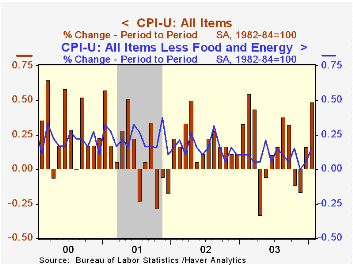
The Consumer Price Index (CPI-U) rose 0.5% in January versus the Consensus expectation for a 0.3% gain. Less food & energy prices rose 0.2%, slightly firmer than the 0.1% Consensus expectation.
Rising energy prices were the source of the upside surprise last month as they jumped 4.7%. Gasoline prices spiked 8.1% (+8.3% y/y) following three months of flat to lower prices. Fuel oil prices also were strong, up 6.8% (9.7% y/y).
Prices of core consumer goods were unchanged following more than a year of deflation. Much of that "firming" came as prices for household furnishings & operation rose 0.4% (-1.6% y/y), only the second monthly increase since February. Apparel prices fell another 0.3% (-1.8% y/y) and new & used motor vehicle prices edged 0.1% lower (-4.0% y/y).
Core services prices were again tame, rising just 0.2%. Shelter prices ticked up only 0.1% (2.0% y/y) and medical care services price inflation eased to 0.3% (4.3% y/y). Public transportation prices rose for the first month in three by 0.2% (2.0% y/y).
The chained CPI which adjusts for shifts in consumer buying behavior rose (0.5%) for the first month since September. It is similar to the PCE price deflator. The core price measure also rose (0.2%) for just the first month in three.
A working paper from the Federal Reserve Bank of Kansas City titled "Disaggregate evidence on the persistence of consumer price inflation" can be viewed here.
| Consumer Price Index | Jan | Dec | Y/Y | 2003 | 2002 | 2001 |
|---|---|---|---|---|---|---|
| Total | 0.5% | 0.2% | 2.0% | 2.3% | 1.6% | 2.8% |
| Total less Food & Energy | 0.2% | 0.1% | 1.1% | 1.5% | 2.3% | 2.7% |
| Goods less Food & Energy | 0.0% | -0.1% | -2.2% | -2.0% | -1.1% | 0.3% |
| Services less Energy | 0.2% | 0.2% | 2.5% | 2.9% | 3.8% | 3.7% |
| Energy | 4.7% | 0.3% | 7.7% | 12.2% | -5.8% | 3.7% |
| Food & Beverages | 0.0% | 0.5% | 3.6% | 2.1% | 1.8% | 3.1% |
| Chained CPI: Total (NSA) | 0.5% | -0.2% | 1.6% | 1.9% | 1.3% | 2.3% |
| Total less Food & Energy | 0.2% | -0.3% | 0.8% | 1.1% | 1.9% | 2.0% |

Tom Moeller
AuthorMore in Author Profile »Prior to joining Haver Analytics in 2000, Mr. Moeller worked as the Economist at Chancellor Capital Management from 1985 to 1999. There, he developed comprehensive economic forecasts and interpreted economic data for equity and fixed income portfolio managers. Also at Chancellor, Mr. Moeller worked as an equity analyst and was responsible for researching and rating companies in the economically sensitive automobile and housing industries for investment in Chancellor’s equity portfolio. Prior to joining Chancellor, Mr. Moeller was an Economist at Citibank from 1979 to 1984. He also analyzed pricing behavior in the metals industry for the Council on Wage and Price Stability in Washington, D.C. In 1999, Mr. Moeller received the award for most accurate forecast from the Forecasters' Club of New York. From 1990 to 1992 he was President of the New York Association for Business Economists. Mr. Moeller earned an M.B.A. in Finance from Fordham University, where he graduated in 1987. He holds a Bachelor of Arts in Economics from George Washington University.
More Economy in Brief


