 Global| Jun 15 2005
Consumer Price Inflation Eased
by:Tom Moeller
|in:Economy in Brief
Summary
The CPI-U fell 0.1% in May, the first m/m decline since last July and compared to Consensus expectations for a 0.1% rise. During the first five months of 2005 the CPI is up 4.7% at an annual rate. Pricing power less food & energy [...]
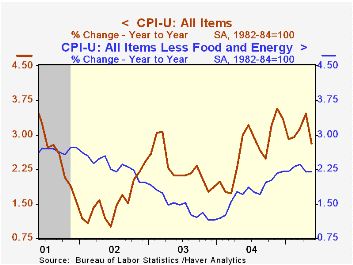
The CPI-U fell 0.1% in May, the first m/m decline since last July and compared to Consensus expectations for a 0.1% rise. During the first five months of 2005 the CPI is up 4.7% at an annual rate.
Pricing power less food & energy continued modest. A 0.1% increase followed no change in April and during the first five months of this year the core CPI is up 2.4% at an annual rate. Consensus expectations had been for a 0.2% May increase.
The 0.2% increase in core goods prices recovered some of April's decline led by a 0.5% m/m gain in used car & truck prices and a 0.5% gain in medical care commodities. Apparel prices were unchanged (-0.8% y/y) following April's 0.6% decline and home furnishings & operation prices rose 0.6% (1.1% y/y) due to strength in the "other" category. New motor vehicle prices rose 0.1% (0.9% y/y).
Services price inflation eased from the low reading in April. Shelter prices were unchanged for the second consecutive month (2.4% y/y) and medical care services prices rose the same 0.3% as during April (5.0% y/y). Public transportation prices were strong for the third consecutive month though the 0.7% gain (3.5% y/y) was down from 1.7% and 1.3% during the prior two months. School tuition costs firmed 0.7% (6.7% y/y).
Energy prices fell 2.0% led by a 4.4% drop in gasoline prices which have fallen another 1.8% so far in June to an average $2.12 per gallon.
Food price inflation eased to 0.1% following the 0.7% jump in April.
The chained CPI which adjusts for shifts in the mix of consumer purchases was unchanged and less food & energy chain prices fell 0.1%.
| Consumer Price Index | May | April | Y/Y | 2004 | 2003 | 2002 |
|---|---|---|---|---|---|---|
| Total | -0.1% | 0.5% | 2.8% | 2.7% | 2.3% | 1.6% |
| Total less Food & Energy | 0.1% | 0.0% | 2.2% | 1.8% | 1.5% | 2.3% |
| Goods less Food & Energy | 0.2% | -0.1% | 0.6% | -0.9% | -2.0% | -1.1% |
| Services less Energy | 0.1% | 0.2% | 2.7% | 2.8% | 2.9% | 3.8% |
| Energy | -2.0% | 4.5% | 9.8% | 10.9% | 12.2% | -5.9% |
| Food | 0.1% | 0.7% | 2.4% | 3.4% | 2.1% | 1.8% |
| Chained CPI: Total (NSA) | 0.0% | 0.5% | 2.5% | 2.3% | 2.0% | 1.3% |
| Total less Food & Energy | -0.1% | 0.2% | 1.8% | 1.5% | 1.1% | 1.9% |

Tom Moeller
AuthorMore in Author Profile »Prior to joining Haver Analytics in 2000, Mr. Moeller worked as the Economist at Chancellor Capital Management from 1985 to 1999. There, he developed comprehensive economic forecasts and interpreted economic data for equity and fixed income portfolio managers. Also at Chancellor, Mr. Moeller worked as an equity analyst and was responsible for researching and rating companies in the economically sensitive automobile and housing industries for investment in Chancellor’s equity portfolio. Prior to joining Chancellor, Mr. Moeller was an Economist at Citibank from 1979 to 1984. He also analyzed pricing behavior in the metals industry for the Council on Wage and Price Stability in Washington, D.C. In 1999, Mr. Moeller received the award for most accurate forecast from the Forecasters' Club of New York. From 1990 to 1992 he was President of the New York Association for Business Economists. Mr. Moeller earned an M.B.A. in Finance from Fordham University, where he graduated in 1987. He holds a Bachelor of Arts in Economics from George Washington University.
More Economy in Brief


