 Global| Aug 29 2006
Consumer Confidence Fell Sharply
by:Tom Moeller
|in:Economy in Brief
Summary
The Conference Board reported that consumer confidence in August fell a sharp 6.9% to 99.6, its lowest level since November. The July level was revised up slightly but Consensus expectations had been for a more moderate decline in [...]
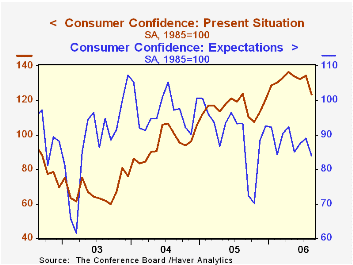
The Conference Board reported that consumer confidence in August fell a sharp 6.9% to 99.6, its lowest level since November. The July level was revised up slightly but Consensus expectations had been for a more moderate decline in August confidence to 102.9.
During the last twenty years there has been a 52% correlation between the level of consumer confidence and the y/y change in real consumer spending. The correlation rose to 66% during the last ten years.
Consumers' assessment of the present situation reversed all of the prior month's modest uptick and fell 8.0% (-0.3% y/y) to the lowest level (123.4) this year. The percentage of respondents who viewed business conditions as good (26.1%) fell though the percentage that viewed jobs as hard to get (21.1%) rose to its highest level this year.
The index measuring consumers' expectations fell 5.7% (-10.2% y/y). Expectations for better business conditions worsened to the lowest (15.9%) since October and fewer respondents expected more jobs.
Expectations for the inflation rate in twelve months jumped to 5.5%, the highest level since May.
The Conference Board’s survey isconducted by a mailed questionnaire to 5,000 households and about 3,500 typically respond.
Wealth inequality is vast and growing from the Economic Policy Institute is available here
| Conference Board | August | July | Y/Y | 2005 | 2004 | 2003 |
|---|---|---|---|---|---|---|
| Consumer Confidence | 99.6 | 107.0 | -5.6s% | 100.3 | 96.1 | 79.8 |
by Tom Moeller August 29, 2006
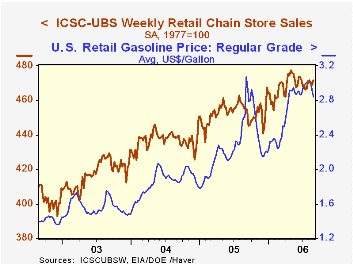
According to the International Council of Shopping Centers (ICSC)-UBS survey, chain store sales rose a moderate 0.6% last week, the first w/w gain since July.
The increase helped the average sales level in August rise 0.4% above July, the first m/m gain in four months. During the last ten years there has been a 47% correlation between the y/y change in chain store sales and the change in nonauto retail sales less gasoline.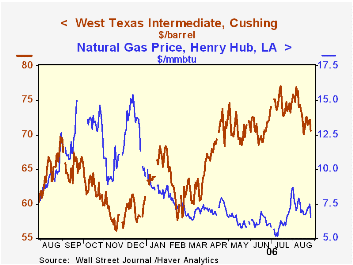
The ICSC-UBS retail chain-store sales index is constructed using the same-store sales (stores open for one year) reported by 78 stores of seven retailers: Dayton Hudson, Federated, Kmart, May, J.C. Penney, Sears and Wal-Mart.
The leading indicator of chain store sales from ICSC-UBS rose a modest 0.1% (-2.4% y/y) in the latest week after several weeks of decline. The retail price for a gallon of regular unleaded gasoline fell another eight cents to an average $2.85 (+9.0% y/y). The decline lowered the average this month to $2.95 versus a July average of $2.98. In spot market trading yesterday, regular unleaded gasoline prices fell sharply to $1.77 as Ernesto was downgraded to a tropical storm and moved out of the Gulf of Mexico. Oil prices similarly fell with the spot price of WTI crude down to $70.62 per bbl. (+5.1% y/y) and the price is lower today. Natural gas prices also fell to $6.52/mmbtu (-33.9% y/y) in spot trading.The latest Short-Term Energy Outlook from the U.S. Energy Information Administration is available here.
| ICSC-UBS (SA, 1977=100) | 08/26/06 | 08/19/06 | Y/Y | 2005 | 2004 | 2003 |
|---|---|---|---|---|---|---|
| Total Weekly Chain Store Sales | 471.7 | 469.1 | 3.6% | 3.6% | 4.7% | 2.9% |
by Louise Curley August 29, 2006

The Japanese Ministry of Internal Affairs and Communication publishes a variety of data relating to household's living expenditures as part of their report on the Family Income and Expenditure Survey. There are data on the actual expenditures for all households and for workers' household. In addition to total expenditures, there are a number of spending categories.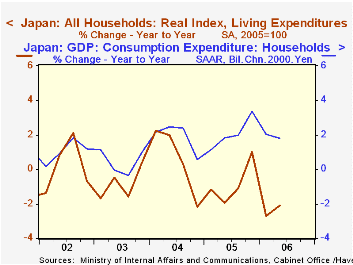 Data are given for "fundamental" and "selective" expenditures, what we would call nondiscretionary and discretionary spending. There are indexes--seasonally adjusted and not seasonally adjusted-- of the actual expenditures based on 2005=100. . Nominal and Real Indexes on a seasonally adjusted basis are available for all households, including agricultural, forestry and fisheries households and for all households excluding those households. Similar data for workers' households are also available. The data start in January 2000.
The monthly data have shown a slight downward trend over the past seven years as can be seen in the first chart that shows the year to year changes in the real and nominal indexes for workers' households. If the monthly data of the real index for living expenditures for all households including agriculture, forestry and fisheries households are aggregated to a quarterly basis, the quarterly data appear to show the same general movement as that shown by household consumption in the national accounts as can be seen in the second chart. Thus the living expenditure data appear to be coincident rather than leading indicators of total household consumption.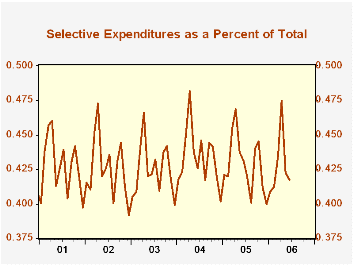
The data can be used to reveal spending patterns. For example, fundamental expenditures tend to take up between 52-58% of total spending while selected expenditures take up between 40-48% as shown in the third chart.
| Japan | Jul 06 | Jun 06 | May 05 | Apr 06 | Mar 06 | 2005 | 2004 | 2003 |
|---|---|---|---|---|---|---|---|---|
| Household Living Expenditures | ||||||||
| All Household (000 Yen) | 292.328 | 280.824 | 292.114 | 312.872 | 313.350 | -0.81 | 0.38 | -1.34 |
| Year/Year % Change | -0.83 | -1.12 | -1.24 | -1.56 | -1.87 | |||
| Workers' HHs (000 Yen) | 320.677 | 301.978 | 310.482 | 346.086 | 340.010 | -0.64 | 1.55 | -1.40 |
| Year/Year % Change | -1.46 | -2.29 | -2.10 | -3.88 | -3.77 | |||
| Workers' Households | ||||||||
| Real (2005=100) | 96.1 | 96.7 | 97.9 | 96.2 | 95.5 | -0.34 | 1.61 | -1.12 |
| Year/Year % Change | -1.74 | -2.91 | -2.30 | -3.90 | -3.34 | |||
| Nominal (2005=100) | 96.4 | 97.0 | 99.2 | 96.3 | 95.3 | -0.70 | 1.61 | -1.38 |
| Year/Year % Change | -1.23 | -2.41 | -2.19 | -4.08 | -3.74 |

Tom Moeller
AuthorMore in Author Profile »Prior to joining Haver Analytics in 2000, Mr. Moeller worked as the Economist at Chancellor Capital Management from 1985 to 1999. There, he developed comprehensive economic forecasts and interpreted economic data for equity and fixed income portfolio managers. Also at Chancellor, Mr. Moeller worked as an equity analyst and was responsible for researching and rating companies in the economically sensitive automobile and housing industries for investment in Chancellor’s equity portfolio. Prior to joining Chancellor, Mr. Moeller was an Economist at Citibank from 1979 to 1984. He also analyzed pricing behavior in the metals industry for the Council on Wage and Price Stability in Washington, D.C. In 1999, Mr. Moeller received the award for most accurate forecast from the Forecasters' Club of New York. From 1990 to 1992 he was President of the New York Association for Business Economists. Mr. Moeller earned an M.B.A. in Finance from Fordham University, where he graduated in 1987. He holds a Bachelor of Arts in Economics from George Washington University.
More Economy in Brief


