Global| Jun 25 2002
Consumer Confidence Down
by:Tom Moeller
|in:Economy in Brief
Summary
The Conference Boards Index of Consumer Confidence fell in June, slightly more than expected. May's level was revised up slightly. The 3.5% m/m decline in the Conference Board measure was less than the decline in the mid-month [...]
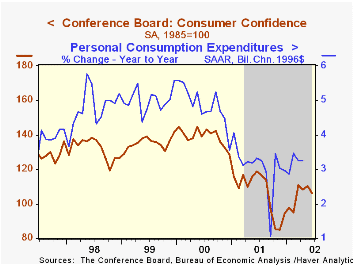
The Conference Board’s Index of Consumer Confidence fell in June, slightly more than expected. May's level was revised up slightly.
The 3.5% m/m decline in the Conference Board measure was less than the decline in the mid-month Sentiment reading from the University of Michigan. Nevertheless, it was the largest monthly drop in Confidence since October.
The 2Q02 level of Consumer Confidence was the highest since 3Q01.
The Conference Board's survey is conducted by a mailed questionnaire to 5,000 households and about 3,500 typically respond.
| Conference Board | June | May | Y/Y | 2001 | 2000 | 1999 |
|---|---|---|---|---|---|---|
| Consumer Confidence | 106.4 | 110.3 | -10.5% | 106.6 | 139.0 | 135.3 |
by Tom Moeller June 25, 2002
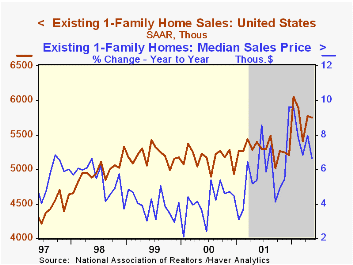
May sales of existing single family homes fell 0.3% versus April that was revised down slightly. Sales during the first five months of 2002 were up 8.2% from the first five months of 2001.
Home sales were mixed across the country’s four regions: up in the Midwest and West, down in the Northeast and South.
The median price of an existing home rose slightly to $154,600 (6.6% y/y). The April figure was revised higher.
The figures reflect closings of past sales.
The average rate on a conventional 30-year mortgage fell to 6.81% last month from 7.07% in December.
| Existing Home Sales (000, AR) | May | April | Y/Y | 2001 | 2000 | 1999 |
|---|---|---|---|---|---|---|
| Existing Single-Family | 5,750 | 5,770 | 6.5% | 5,291 | 5,159 | 5,193 |
by Tom Moeller June 25, 2002

Chain store sales rose 0.5% in the third week of June according to the BTM-UBSW survey. It was the fourth consecutive weekly rise.
So far in June sales are up 2.1% from the May average.
The leading indicator of chain store sales published by BTM rose slightly in the second week of June, recouping a part of the decline the prior week.
During the last ten years there has been a 40% correlation between the year-to-year percent change in monthly chain store sales and the change in general merchandise store sales.
| BTM-UBSW (SA, 1977=100) | 6/22/02 | 6/15/02 | Y/Y | 2001 | 2000 | 1999 |
|---|---|---|---|---|---|---|
| Total Weekly Retail Chain Store Sales | 416.7 | 414.6 | 4.9% | 2.1% | 3.4% | 6.7% |

Tom Moeller
AuthorMore in Author Profile »Prior to joining Haver Analytics in 2000, Mr. Moeller worked as the Economist at Chancellor Capital Management from 1985 to 1999. There, he developed comprehensive economic forecasts and interpreted economic data for equity and fixed income portfolio managers. Also at Chancellor, Mr. Moeller worked as an equity analyst and was responsible for researching and rating companies in the economically sensitive automobile and housing industries for investment in Chancellor’s equity portfolio. Prior to joining Chancellor, Mr. Moeller was an Economist at Citibank from 1979 to 1984. He also analyzed pricing behavior in the metals industry for the Council on Wage and Price Stability in Washington, D.C. In 1999, Mr. Moeller received the award for most accurate forecast from the Forecasters' Club of New York. From 1990 to 1992 he was President of the New York Association for Business Economists. Mr. Moeller earned an M.B.A. in Finance from Fordham University, where he graduated in 1987. He holds a Bachelor of Arts in Economics from George Washington University.
More Economy in Brief