 Global| Apr 13 2009
China's March Exports Up Close to 40%: Imports Up 20%
Summary
China is one of the earliest countries to report March trade data. On a seasonally unadjusted basis exports were up 39.1% in March after falling for five successive months. Exports are still 17% below the year ago figure, but that is [...]
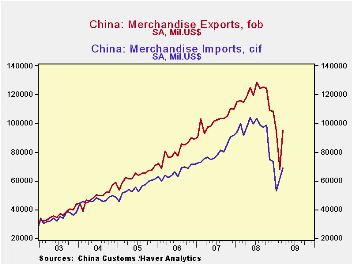 China is one of the earliest countries to report March trade
data. On a seasonally unadjusted basis exports were up 39.1% in March
after falling for five successive months. Exports are still 17% below
the year ago figure, but that is an improvement over February's showing
of exports 25% below a year ago. Imports have increased in both
February and March, but are still 25% below a year ago. China's exports
and imports are shown in the first chart.
China is one of the earliest countries to report March trade
data. On a seasonally unadjusted basis exports were up 39.1% in March
after falling for five successive months. Exports are still 17% below
the year ago figure, but that is an improvement over February's showing
of exports 25% below a year ago. Imports have increased in both
February and March, but are still 25% below a year ago. China's exports
and imports are shown in the first chart.
An increase in China's exports usually indicates an
improvement in the economic climate of its customers and an increase in
China's imports usually indicates an improvement in its own economic
climate. However, one month increases in unseasonally adjusted data do
not assure a change in trend. The increase in China's trade is a good
omen for world trade but, once again, one month's change does not mean
a change in the trend.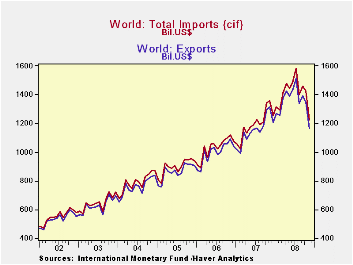
Data on total world exports and imports are compiled by the International Monetary Fund and are available in the monthly Haver Database IMFDOT. Because of the difficulty of collecting the data, they are not very current. The latest data now available are for November 2008. They show sharp drops in both exports and imports for that month, as shown in the second chart. Country data that are more up to date have been showing declines in exports and imports through February 2009.
| CHINA | Mar 09 | Feb 09 | Jan 09 | Dec 08 | Nov 08 | Oct 08 | Sep 08 |
|---|---|---|---|---|---|---|---|
| Exports (Mil USD) | 90291 | 64895 | 90454 | 111157 | 114987 | 128327 | 136411 |
| Imports | 71729 | 60054 | 51344 | 72177 | 74897 | 93088 | 107045 |
| Surplus | 18562 | 4841 | 39110 | 38980 | 40090 | 35239 | 29366 |
More Economy in Brief


