 Global| Apr 28 2004
Chicago Fed Nat'l Activity Index Slipped in March
by:Tom Moeller
|in:Economy in Brief
Summary
The Chicago Fed National Activity Index (CFNAI) slipped in March to 0.17 from 0.47 in February. The latest was the lowest reading since October. The three-month moving average of the CFNAI was about unchanged at 0.35. A zero value of [...]
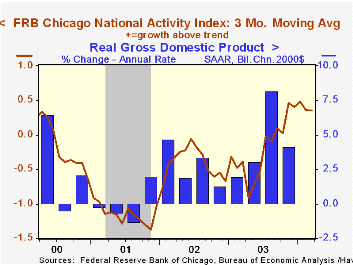
The Chicago Fed National Activity Index (CFNAI) slipped in March to 0.17 from 0.47 in February. The latest was the lowest reading since October.
The three-month moving average of the CFNAI was about unchanged at 0.35.
A zero value of the CFNAI indicates that the economy is expanding at its historical trend rate of growth.
During the last twenty years there has been a 75% correlation between the level of the CFNAI and quarterly growth in real GDP.
The CFNAI is a weighted average of 85 indicators of economic activity. The indicators reflect activity in the following categories: production and income, the labor market, personal consumption and housing, manufacturing and trade sales, and inventories & orders.
The latest release of the Chicago Fed's National Activity Index is available here.
Comments from Michael H. Moskow, President & CEO of the Federal Reserve Bank of Chicago, on the U.S. Economic Outlook can be found here.
| Chicago Fed | Mar | Feb | Mar '03 | 2003 | 2002 | 2001 |
|---|---|---|---|---|---|---|
| CFNAI | 0.17 | 0.47 | -0.66 | -0.11 | -0.40 | -1.18 |
by Tom Moeller April 28, 2004
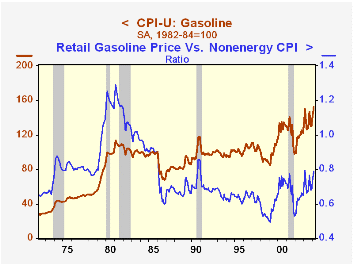
The US average retail gasoline price for all formulations settled last week at $1.81 per gallon versus an average of $1.74 in March and $1.65 February.
Relative to all consumer prices for non-energy goods & services, gasoline prices are back to the highs of a year ago. The current level of relative gasoline prices is up nearly 50% from the low in late 2001 and it is up 60% from the 1999 low.
Despite these gains, relative gasoline prices are down 40% versus the peak in early 1981 and versus disposable personal income (purchasing power) retail gasoline prices are down roughly two-thirds during that period.
Wholesale natural gas prices last week averaged 5.56/mmbtu (+0.9% y/y) and have meandered this year between 5.14 & 6.67/mmbtu.
Crude oil prices have moved higher this year with the price of West Texas Intermediate crude at $37.25 (+47.6% y/y) yesterday.
For the latest Short Term Energy Outlook from the US Department of Energy click here.
Federal Reserve Chairman Alan Greenspan's testimony yesterday on energy is available here.
| US Retail Gasoline Prices | 04/26/04 | 12/29/03 | Y/Y | 2003 | 2002 | 2001 |
|---|---|---|---|---|---|---|
| All Formulations ($/Gal.) | $1.81 | $1.48 | 16.4% | $1.56 | $1.34 | $1.42 |
by Tom Moeller April 28, 2004
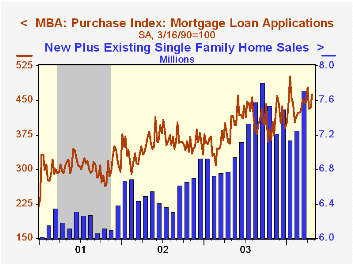
The index of mortgage applications compiled by the Mortgage Bankers Association ticked 0.5% (-28.8% y/y) higher last week following four weeks of sharp decline.
The increase was fueled by a 6.8% w/w rise in purchase applications (+30.2% y/y). So far in April purchase applications are 1.9% ahead of the March average.
During the last ten years there has been a 56% correlation between the y/y change in purchase applications and the change in new plus existing home sales.
Applications to refinance dropped another 5.8% (-52.8% y/y), the fifth consecutive steep weekly decline.
The effective interest rate on a conventional 30-Year mortgage jumped to 6.27% from 6.11% the week prior and from 5.65% averaged in March. The effective rate on a 15-year mortgage rose to 5.63% from 5.49% the week prior and from 5.00% in March.
The Mortgage Bankers Association surveys between 20 to 35 of the top lenders in the U.S. housing industry to derive its refinance, purchase and market indexes. The weekly survey accounts for more than 40% of all applications processed each week by mortgage lenders. Visit the Mortgage Bankers Association site here.
| MBA Mortgage Applications (3/16/90=100) | 04/23/04 | 04/16/04 | 2003 | 2002 | 2001 |
|---|---|---|---|---|---|
| Total Market Index | 748.0 | 744.5 | 1,067.9 | 799.7 | 625.6 |
| Purchase | 463.5 | 434.1 | 395.1 | 354.7 | 304.9 |
| Refinancing | 2,403.0 | 2,550.3 | 4,981.8 | 3,388.0 | 2,491.0 |

Tom Moeller
AuthorMore in Author Profile »Prior to joining Haver Analytics in 2000, Mr. Moeller worked as the Economist at Chancellor Capital Management from 1985 to 1999. There, he developed comprehensive economic forecasts and interpreted economic data for equity and fixed income portfolio managers. Also at Chancellor, Mr. Moeller worked as an equity analyst and was responsible for researching and rating companies in the economically sensitive automobile and housing industries for investment in Chancellor’s equity portfolio. Prior to joining Chancellor, Mr. Moeller was an Economist at Citibank from 1979 to 1984. He also analyzed pricing behavior in the metals industry for the Council on Wage and Price Stability in Washington, D.C. In 1999, Mr. Moeller received the award for most accurate forecast from the Forecasters' Club of New York. From 1990 to 1992 he was President of the New York Association for Business Economists. Mr. Moeller earned an M.B.A. in Finance from Fordham University, where he graduated in 1987. He holds a Bachelor of Arts in Economics from George Washington University.
More Economy in Brief


