 Global| Jun 27 2005
Chicago Fed Nat'l Activity Index Indicates Trend US GDP Growth
by:Tom Moeller
|in:Economy in Brief
Summary
At 0.10 in May, the National Activity Index (CFNAI) compiled by the Federal Reserve Bank of Chicago continued to suggest that US economic growth has slowed.The slowdown, however, would be from the heady rates of growth during 2004 [...]
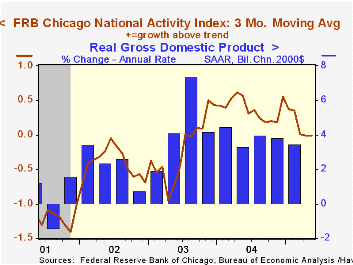
At 0.10 in May, the National Activity Index (CFNAI) compiled by the Federal Reserve Bank of Chicago continued to suggest that US economic growth has slowed.The slowdown, however, would be from the heady rates of growth during 2004 near 4%.
The May figure left the three-month moving average of the CFNAI at -0.01.
A zero value of the CFNAI indicates that the economy is expanding at its historical trend rate of growth.
The CFNAI is a weighted average of 85 indicators of economic activity. The indicators reflect activity in the following categories: production and income, the labor market, personal consumption and housing, manufacturing and trade sales, and inventories & orders.
During the last twenty years there has been a 74% correlation between the level of the CFNAI and q/q growth in real GDP.
The latest CFNAI report is available here.
| Chicago Fed | May | April | May '04 | 2004 | 2003 | 2002 |
|---|---|---|---|---|---|---|
| CFNAI | 0.10 | 0.05 | 0.57 | 0.39 | -0.11 | -0.40 |
by Tom Moeller June 27, 2005
Liquidity growth in the US has slowed markedly this year versus the charged growth rates during the prior three years. Growth during the last three months in the adjusted monetary base fell to 1.2% versus 5.3% growth last year and 8.6% growth during 2002.
Contributing to this slowdown, if not causing it, has been the increase in the targeted interest rate for Fed funds to 3.0% from 1.0%.
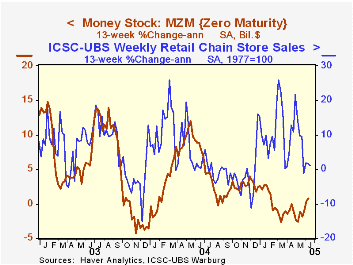
Growth in MZM also has slowed to 0.8% during the last three months versus 3.9% during 2004 and 13.0% growth during 2002. The pickup in the most recent MZM growth rate from below zero may indicate continued life for consumer spending.
A Neutral Federal Funds Rate? from the Federal Reserve Bank of St. Louis can be found here.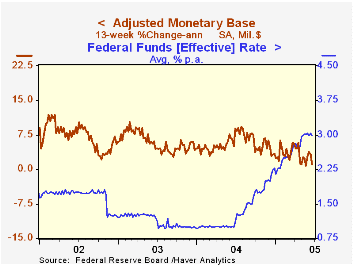
| Money Supply | 6/22/05 (13 Week %, AR) | Y/Y | 2004 | 2003 | 2002 |
|---|---|---|---|---|---|
| Adjusted Monetary Base | 1.2% | 4.4% | 5.3% | 6.3% | 8.6% |
| MZM | 0.8% | 0.5% | 3.9% | 7.4% | 13.0% |

Tom Moeller
AuthorMore in Author Profile »Prior to joining Haver Analytics in 2000, Mr. Moeller worked as the Economist at Chancellor Capital Management from 1985 to 1999. There, he developed comprehensive economic forecasts and interpreted economic data for equity and fixed income portfolio managers. Also at Chancellor, Mr. Moeller worked as an equity analyst and was responsible for researching and rating companies in the economically sensitive automobile and housing industries for investment in Chancellor’s equity portfolio. Prior to joining Chancellor, Mr. Moeller was an Economist at Citibank from 1979 to 1984. He also analyzed pricing behavior in the metals industry for the Council on Wage and Price Stability in Washington, D.C. In 1999, Mr. Moeller received the award for most accurate forecast from the Forecasters' Club of New York. From 1990 to 1992 he was President of the New York Association for Business Economists. Mr. Moeller earned an M.B.A. in Finance from Fordham University, where he graduated in 1987. He holds a Bachelor of Arts in Economics from George Washington University.
More Economy in Brief


