 Global| Dec 21 2004
Chicago Fed Nat'l Activity Index Down: Above Trend Growth Still Suggested
by:Tom Moeller
|in:Economy in Brief
Summary
The November National Activity Index (CFNAI) compiled by the Federal Reserve Bank of Chicago fell to 0.12 from a downwardly revised 0.49 the prior month. The figure continues to suggest that the U.S. economy is expanding. The decline [...]
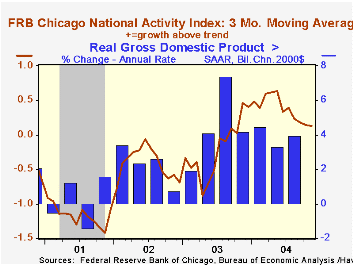
The November National Activity Index (CFNAI) compiled by the Federal Reserve Bank of Chicago fell to 0.12 from a downwardly revised 0.49 the prior month. The figure continues to suggest that the U.S. economy is expanding.
The decline lowered slightly the three-month moving average of the CFNAI to 0.13, the lowest level in a year. A zero value of the CFNAI indicates that the economy is expanding at its historical trend rate of growth.
During the last twenty years there has been a 74% correlation between the level of the CFNAI and q/q growth in real GDP.
The CFNAI is a weighted average of 85 indicators of economic activity. The indicators reflect activity in the following categories: production and income, the labor market, personal consumption and housing, manufacturing and trade sales, and inventories & orders.
The latest CFNAI report is available here.
The future was the topic at this Economic Outlook Symposium.
| Chicago Fed | Nov | Oct | Nov '03 | 2003 | 2002 | 2001 |
|---|---|---|---|---|---|---|
| CFNAI | 0.12 | 0.49 | 0.85 | -0.11 | -0.40 | -1.19 |
by Tom Moeller December 21, 2004
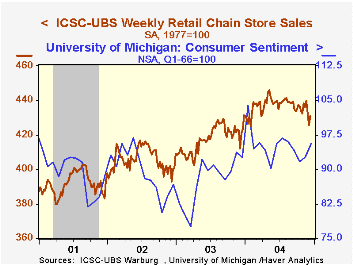
Chain store sales rose another 1.6% last week and added to the 1.2% rise during the first full week of December, according to the International Council of Shopping Centers (ICSC)-UBS.
The average of sales so far in December is 1.2% below November although strength during the last two weeks nearly recouped all of the declines of the prior two periods.
Consumers' spending budgets benefited from another decline in gasoline prices. Last week, the average pump price for regular unleaded fell 3.2 cents to $1.815 per gallon (+22.2% y/y). The U.S. Energy Information Administration indicated that gas prices are down 10.8% from the peak in late October.
The leading indicator of chain store sales from ICSC surged 1.2% in the latest period, the first gain in six weeks.
The ICSC-UBS retail chain-store sales index is constructed using the same-store sales (stores open for one year) reported by 78 stores of seven retailers: Dayton Hudson, Federated, Kmart, May, J.C. Penney, Sears and Wal-Mart.
During the last ten years there has been a 60% correlation between y/y change in chain store sales and the change in non-auto retail sales less gasoline, as published by the US Census Department.
| ICSC-UBS (SA, 1977=100) | 12/18/04 | 12/11/04 | Y/Y | 2003 | 2002 | 2001 |
|---|---|---|---|---|---|---|
| Total Weekly Chain Store Sales | 437.9 | 430.9 | 3.5% | 2.9% | 3.6% | 2.1% |

Tom Moeller
AuthorMore in Author Profile »Prior to joining Haver Analytics in 2000, Mr. Moeller worked as the Economist at Chancellor Capital Management from 1985 to 1999. There, he developed comprehensive economic forecasts and interpreted economic data for equity and fixed income portfolio managers. Also at Chancellor, Mr. Moeller worked as an equity analyst and was responsible for researching and rating companies in the economically sensitive automobile and housing industries for investment in Chancellor’s equity portfolio. Prior to joining Chancellor, Mr. Moeller was an Economist at Citibank from 1979 to 1984. He also analyzed pricing behavior in the metals industry for the Council on Wage and Price Stability in Washington, D.C. In 1999, Mr. Moeller received the award for most accurate forecast from the Forecasters' Club of New York. From 1990 to 1992 he was President of the New York Association for Business Economists. Mr. Moeller earned an M.B.A. in Finance from Fordham University, where he graduated in 1987. He holds a Bachelor of Arts in Economics from George Washington University.
More Economy in Brief


