 Global| Mar 22 2010
Chicago Fed Index Indicates Slower Growth Last Month
by:Tom Moeller
|in:Economy in Brief
Summary
Economic activity slowed last month according to the Chicago Fed National Activity Index (CFNAI) from the Federal Reserve Bank of Chicago. Was severe winter weather behind the slowdown or was there more behind the index decline to [...]
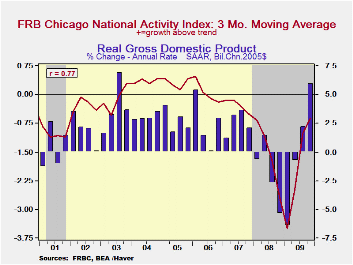
Economic activity slowed last month according to the Chicago Fed National Activity Index (CFNAI) from the Federal Reserve Bank of Chicago. Was severe winter weather behind the slowdown or was there more behind the index decline to -0.64 from a downwardly revised -0.04 in January? Regardless, positive economic growth still was indicated by the increase from the series' low of -4.14 reached one year ago. During the last ten years the has been a 76% correlation between the index level and the q/q change in real GDP.
The three-month moving average of the index, which smoothes out some of the series' volatility, also fell to -0.39 from its highest level since 2007.
An index level at or below -0.70 typically has indicated negative U.S. economic growth. A zero value of the CFNAI indicates that the economy is expanding at its historical trend rate of growth of roughly 3.0%. The complete CFNAI report is available here.
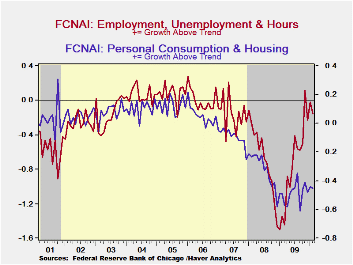
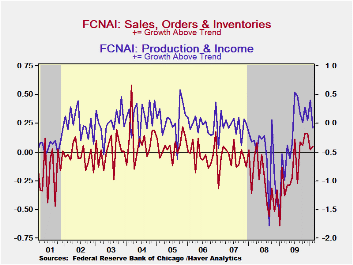
The Chicago Fed indicated that each of the series' components except sales, inventories & orders contributed negatively to the overall decline. Overall, a reduced 34 of the 85 individual indicators made positive contributions to the index while 51 made negative contributions. The CFNAI is a weighted average of 85 indicators of economic activity. The indicators reflect activity in the following categories: production & income, the labor market, personal consumption & housing, manufacturing & trade sales, and inventories & orders.
In a separate survey, the Chicago Fed indicated that its Midwest manufacturing index improved during January to its highest level since December 2008. Indicators for the auto, steel, machinery and resource sectors each rose. The Chicago Federal Reserve figures are available in Haver's SURVEYS database.
| Chicago Fed | February | January | December | February '09 | 2009 | 2008 | 2007 |
|---|---|---|---|---|---|---|---|
| CFNAI | -0.64 | -0.04 | -0.50 | -2.48 | -1.62 | -1.79 | -0.35 |
| 3-Month Moving Average | -0.39 | -0.13 | -0.42 | -3.47 | -- | -- | -- |
| Personal Consumption & Housing | -0.45 | -0.44 | -0.48 | -0.49 | -0.49 | -0.32 | -0.09 |
| Employment, Unemployment & Hours | -0.16 | -0.02 | -0.23 | -1.34 | -0.76 | -0.67 | -0.15 |
| Production & Income | -0.08 | 0.41 | 0.05 | -0.53 | -0.24 | -0.56 | -0.05 |
| Sales, Inventories & Orders | 0.05 | 0.02 | 0.16 | -0.13 | -0.15 | -0.25 | -0.06 |

Tom Moeller
AuthorMore in Author Profile »Prior to joining Haver Analytics in 2000, Mr. Moeller worked as the Economist at Chancellor Capital Management from 1985 to 1999. There, he developed comprehensive economic forecasts and interpreted economic data for equity and fixed income portfolio managers. Also at Chancellor, Mr. Moeller worked as an equity analyst and was responsible for researching and rating companies in the economically sensitive automobile and housing industries for investment in Chancellor’s equity portfolio. Prior to joining Chancellor, Mr. Moeller was an Economist at Citibank from 1979 to 1984. He also analyzed pricing behavior in the metals industry for the Council on Wage and Price Stability in Washington, D.C. In 1999, Mr. Moeller received the award for most accurate forecast from the Forecasters' Club of New York. From 1990 to 1992 he was President of the New York Association for Business Economists. Mr. Moeller earned an M.B.A. in Finance from Fordham University, where he graduated in 1987. He holds a Bachelor of Arts in Economics from George Washington University.
More Economy in Brief


