 Global| Mar 11 2003
Chain Store Sales Recovered Further
by:Tom Moeller
|in:Economy in Brief
Summary
Chain store sales rose 0.6% last week and added to a 0.2% rise the week prior according to the BTM-UBSW survey. Sales began the month of March 0.3% ahead of the February average. During the last five years there has been a 62% [...]
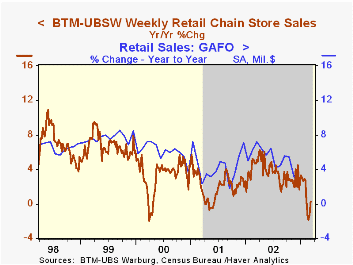
Chain store sales rose 0.6% last week and added to a 0.2% rise the week prior according to the BTM-UBSW survey.
Sales began the month of March 0.3% ahead of the February average.
During the last five years there has been a 62% correlation between the year-to-year percent change in these monthly chain store sales and the change in retail sales of general merchandise, apparel and furniture (GAF, 26% of total retail sales). That correlation is comparable to the 68% correlation between Same Store sales as published by Redbook Instinet Research and GAF sales.
| BTM-UBSW (SA, 1977=100) | 3/08/03 | 3/01/03 | Y/Y | 2002 | 2001 | 2000 |
|---|---|---|---|---|---|---|
| Total Weekly Retail Chain Store Sales | 408.2 | 405.9 | 0.3% | 3.6% | 2.1% | 3.4% |
by Tom Moeller March 11, 2003
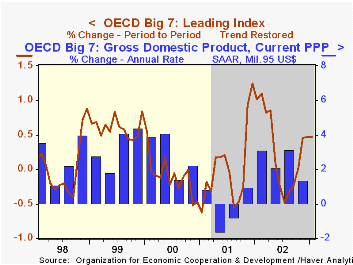
The OECD Index of Leading Indicators (Big 7) rose in January for the third consecutive month. The 0.5% gain was the same as in December and November.
Like earlier months, gains in the leading index have been dominated by improvement in the US where leaders have risen solidly in each of the last three months.
Leaders for Europe (23 countries) have been about unchanged in each of the last six months and are down 0.2% since May.
Leaders for Japan rose 0.4% in January, the third moderate gain in the last four months.
| OECD Main Economic Indicators | Jan | Dec | Y/Y | 2002 | 2001 | 2000 |
|---|---|---|---|---|---|---|
| OECD Major Seven - Leading Index (Trend Restored) | 120.0 | 119.5 | 3.0% | 4.2% | -2.1% | 3.3% |
| Europe | 117.0 | 117.0 | 2.6% | 3.2% | -2.4% | 4.1% |
| Japan | 101.1 | 100.7 | 1.8% | 0.6% | -3.1% | 2.4% |
| United States | 132.7 | 131.5 | 3.6% | 5.9% | -2.3% | 3.0% |
by Tom Moeller March 11, 2003
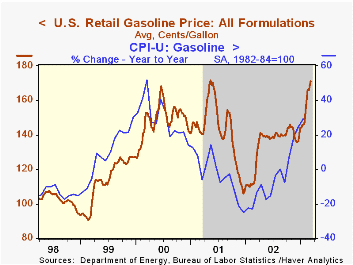
Retail gasoline prices rose to a near-record last week. Prices so far this year have risen roughly 20% from yearend 2002.
The gain in gasoline prices has followed closely the surge in crude oil prices. The price of West Texas Intermediate crude was $36.88 per barrel last week, up 59.1% y/y.
Wholesale natural gas prices rose to $7.84/mmbtu last week, up from just over $2.00 early last year.
| US Retail Gasoline Prices | 03/10/03 | 12/30/02 | Y/Y | 2002 | 2001 | 2000 |
|---|---|---|---|---|---|---|
| All Formulations ($/Gal.) | $1.71 | $1.44 | 40.0% | $1.34 | $1.42 | $1.48 |

Tom Moeller
AuthorMore in Author Profile »Prior to joining Haver Analytics in 2000, Mr. Moeller worked as the Economist at Chancellor Capital Management from 1985 to 1999. There, he developed comprehensive economic forecasts and interpreted economic data for equity and fixed income portfolio managers. Also at Chancellor, Mr. Moeller worked as an equity analyst and was responsible for researching and rating companies in the economically sensitive automobile and housing industries for investment in Chancellor’s equity portfolio. Prior to joining Chancellor, Mr. Moeller was an Economist at Citibank from 1979 to 1984. He also analyzed pricing behavior in the metals industry for the Council on Wage and Price Stability in Washington, D.C. In 1999, Mr. Moeller received the award for most accurate forecast from the Forecasters' Club of New York. From 1990 to 1992 he was President of the New York Association for Business Economists. Mr. Moeller earned an M.B.A. in Finance from Fordham University, where he graduated in 1987. He holds a Bachelor of Arts in Economics from George Washington University.
More Economy in Brief


