 Global| Jan 13 2004
Chain Store Sales Down Again
by:Tom Moeller
|in:Economy in Brief
Summary
Chain store sales fell 0.4% last week and that followed a 0.1% dip in the opening week of 2004, according to the ICSC-UBS survey. So far in January sales are up 1.9% versus December. During the last five years there has been a 61% [...]
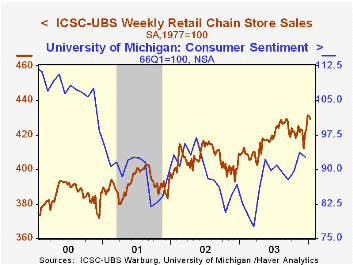
Chain store sales fell 0.4% last week and that followed a 0.1% dip in the opening week of 2004, according to the ICSC-UBS survey.
So far in January sales are up 1.9% versus December.
During the last five years there has been a 61% correlation between the year-to-year percent change in the ICSC-UBS measure of chain store sales and the change in non-auto retail sales less gasoline.
The ICSC-UBS retail chain-store sales index is constructed using the same-store sales reported by 78 stores of seven retailers: Dayton Hudson, Federated, Kmart, May, J.C. Penney, Sears and Wal-Mart.
| ICSC-UBS (SA, 1977=100) | 01/10/04 | 01/03/04 | Y/Y | 2003 | 2002 | 2001 |
|---|---|---|---|---|---|---|
| Total Weekly Retail Chain Store Sales | 429.2 | 430.9 | 4.9% | 2.9% | 3.6% | 2.1% |
by Tom Moeller January 13, 2004
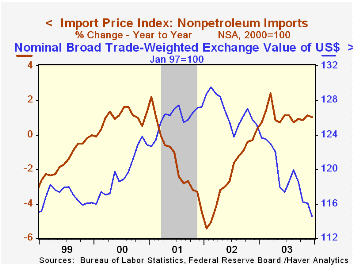
Imported commodities prices rose 0.2% last month, much less than Consensus expectations for a 0.5% increase. Prices in November were revised up due to a raised estimate of petroleum prices but the previously reported November gain in nonpetroleum import prices was revised down to 0.2% from 0.3%.
Non-petroleum import prices rose just 0.1% last month and reflected broad based weakness. Capital goods prices fell 0.2% and were down 1.3% during all of last year. Non-auto consumer goods prices were unchanged m/m and down 0.2% for the year while auto prices also were unchanged m/m for the second consecutive month.
During the last fifteen years there has been a (negative) 54% correlation between the trade-weighted exchange value of the dollar and the y/y change in nonpetroleum import prices
Petroleum prices rose 1.8% in December and have risen further in January. The price of Brent Crude Oil has neared $32.00/bbl this month versus $29.69 averaged in December.
Export prices rose a moderate 0.2% though foods, feeds & beverages prices continued strong, up 1.0% m/m and 8.4% for the year. Nonagricultural export prices rose 0.2% m/m and 1.0% in 2003.
| Import/Export Prices (NSA) | Dec | Nov | Y/Y | 2003 | 2002 | 2001 |
|---|---|---|---|---|---|---|
| Import - All Commodities | 0.2% | 0.5% | 1.9% | 2.9% | -2.5% | -3.5% |
| Petroleum | 1.8% | 2.1% | 9.1% | 20.6% | 3.0% | -17.2% |
| Non-petroleum | 0.1% | 0.2% | 1.0% | 1.1% | -2.4% | -1.5% |
| Export - All Commodities | 0.2% | 0.5% | 2.2% | 1.6% | -1.0% | -0.8% |

Tom Moeller
AuthorMore in Author Profile »Prior to joining Haver Analytics in 2000, Mr. Moeller worked as the Economist at Chancellor Capital Management from 1985 to 1999. There, he developed comprehensive economic forecasts and interpreted economic data for equity and fixed income portfolio managers. Also at Chancellor, Mr. Moeller worked as an equity analyst and was responsible for researching and rating companies in the economically sensitive automobile and housing industries for investment in Chancellor’s equity portfolio. Prior to joining Chancellor, Mr. Moeller was an Economist at Citibank from 1979 to 1984. He also analyzed pricing behavior in the metals industry for the Council on Wage and Price Stability in Washington, D.C. In 1999, Mr. Moeller received the award for most accurate forecast from the Forecasters' Club of New York. From 1990 to 1992 he was President of the New York Association for Business Economists. Mr. Moeller earned an M.B.A. in Finance from Fordham University, where he graduated in 1987. He holds a Bachelor of Arts in Economics from George Washington University.
More Economy in Brief


