 Global| Mar 29 2005
Chain Store Sales Crimped By Higher Gas Prices & Inclement Weather
by:Tom Moeller
|in:Economy in Brief
Summary
Chain store sales fell 1.0% last week. Abundant rain, warm temperatures and, versus February, a 12% rise in gasoline prices to an average $2.15 per gallon may have caused the spending decline. The y/y gain in sales improved in part [...]
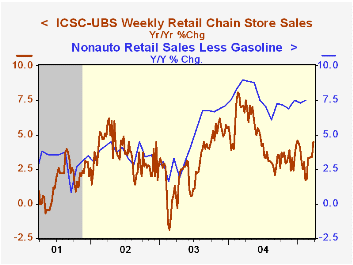
Chain store sales fell 1.0% last week. Abundant rain, warm temperatures and, versus February, a 12% rise in gasoline prices to an average $2.15 per gallon may have caused the spending decline. The y/y gain in sales improved in part due to the early timing of Easter in 2005.
Consumers' pause came after spending enough to lift the average of sales in March 1.1% ahead of February according to the International Council of Shopping Centers (ICSC)-UBS survey.
During the last ten years there has been a 56% correlation between the y/y change in chain store sales and the change in non-auto retail sales less gasoline, as published by the US Census Department. Chain store sales correspond directly with roughly 14% of nonauto retail sales less gasoline.
The leading indicator of chain store sales from ICSC slipped 0.5% (-0.6% y/y) and gave back all of the moderate gains during the prior two weeks.
The ICSC-UBS retail chain-store sales index is constructed using the same-store sales (stores open for one year) reported by 78 stores of seven retailers: Dayton Hudson, Federated, Kmart, May, J.C. Penney, Sears and Wal-Mart.
Consumer Sentiment, the Economy, and the News Media from the Federal Reserve Board can be found here.
| ICSC-UBS (SA, 1977=100) | 03/26/05 | 03/19/05 | Y/Y | 2004 | 2003 | 2002 |
|---|---|---|---|---|---|---|
| Total Weekly Chain Store Sales | 450.2 | 454.6 | 4.5% | 4.6% | 2.9% | 3.6% |
by Tom Moeller March 29, 2005
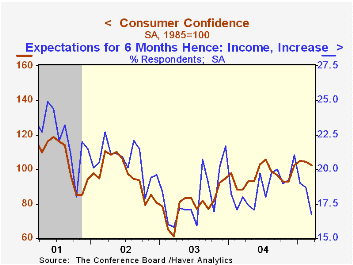
The March Index of Consumer Confidence published by the Conference Board fell 1.9% to 102.4 from an upwardly revised February level. Consensus expectations had been for a reading of 103.0 and the decline followed a 0.7% drop in February.
During the last twenty years there has been a 51% correlation between the level of consumer confidence and the y/y change in real consumer spending. The correlation rose to 66% during the last ten years.
The March index of consumer expectations fell for the third consecutive month (+2.6% y/y) following an 11.6% surge in December. The present situation index fell modestly (+37.0% y/y) after rising strongly in the prior four months.
Jobs were viewed as hard to get by 23.8% of survey participants, up slightly from the February low. Expectations for income in six months grew poorer as fewer respondents (16.7%) expected an increase and more expected a decrease (9.3%).
The Conference Board’s survey isconducted by a mailed questionnaire to 5,000 households and about 3,500 typically respond.
| Conference Board | Mar | Feb | Y/Y | 2004 | 2003 | 2002 |
|---|---|---|---|---|---|---|
| Consumer Confidence | 102.4 | 104.4 | 15.7% | 96.1 | 79.8 | 96.6 |
by Louise Curley March 29, 2005
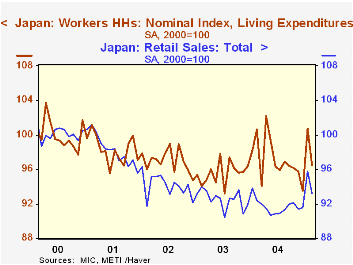
After strong economic data for Japan in January, the latest indicators are disappointing. Retail sales declined by almost 3% from January to February and were only 0.9% above February, 2004. Employment declined 0.4% in February and unemployment was up 2.7%, resulting in a 2 percentage point increase in the unemployment rate to 4.7%
In spite of lower employment, the average worker's household income increased by 4.5% in February and his disposable income was up 5%, suggesting an increase in wages. These data are, however, seasonally unadjusted. The seasonally adjusted index of worker's income actually shows a decline of 0.3%. Such a decline together with concern over employment prospects as a result of the rise in the unemployment rate may have been an important factor causing the average household to reduce living expenditures by almost 9% seasonally unadjusted or 4% seasonally adjusted in the month. The indexes of the worker household's expenditures and the broader retail sales series are shown in the attached chart.
| Feb 05 | Jan 05 | Feb 04 | M/M% | Y/Y% | 2004 % | 2003% | 2002% | |
|---|---|---|---|---|---|---|---|---|
| Employment (10,000) | 6339 | 6357 | 6324 | -0.4 | 0.2 | 0.2 | -0.2 | -1.3 |
| Unemployment (10,000) | 310 | 302 | 332 | 2.6 | -6.6 | -10.6 | -2.4 | 5.5 |
| Retail Sales (2000=1000 | 93.2 | 95.8 | 92.4 | -2.7 | 0.9 | -0.9 | -1.7 | -4.3 |
| Worker's Household | ||||||||
| Income (1000 Yen) | 469.9 | 119.7 | 472.8 | 4.5 | -0.6 | 1.0 | -2.6 | -2.3 |
| Income (2000=1000 | 95.6 | 95.9 | 96.3 | -0.3 | -0.7 | 1.3 | -2.9 | -2.2 |
| Disposable Inc (1000 Yen) | 400.1 | 381.1 | 403.9 | 5.0 | -1.0 | 1.0 | -2.7 | -2.6 |
| Living Expenditures (1000 Yen) | 371.2 | 406.8 | 383.3 | -8.7 | -3.1 | 1.5 | -1.6 | -1.2 |
| Living Expenditures(2000=100) | 96.5 | 100.7 | 100.6 | -4.2 | -4.1 | 1.6 | -1.5 | -1.4 |

Tom Moeller
AuthorMore in Author Profile »Prior to joining Haver Analytics in 2000, Mr. Moeller worked as the Economist at Chancellor Capital Management from 1985 to 1999. There, he developed comprehensive economic forecasts and interpreted economic data for equity and fixed income portfolio managers. Also at Chancellor, Mr. Moeller worked as an equity analyst and was responsible for researching and rating companies in the economically sensitive automobile and housing industries for investment in Chancellor’s equity portfolio. Prior to joining Chancellor, Mr. Moeller was an Economist at Citibank from 1979 to 1984. He also analyzed pricing behavior in the metals industry for the Council on Wage and Price Stability in Washington, D.C. In 1999, Mr. Moeller received the award for most accurate forecast from the Forecasters' Club of New York. From 1990 to 1992 he was President of the New York Association for Business Economists. Mr. Moeller earned an M.B.A. in Finance from Fordham University, where he graduated in 1987. He holds a Bachelor of Arts in Economics from George Washington University.
More Economy in Brief


