 Global| Apr 27 2010
Case-Shiller Home Price IndexContinues Sideways Movement
by:Tom Moeller
|in:Economy in Brief
Summary
Earlier improvement in home prices continued to weaken during February. Seasonally adjusted, the Case-Shiller Home Price Index slipped 0.1% and continued its sideways pattern since September. Nevertheless, the 0.7% increase versus [...]

Earlier improvement in home prices continued to weaken during February. Seasonally adjusted, the Case-Shiller Home Price Index slipped 0.1% and continued its sideways pattern since September. Nevertheless, the 0.7% increase versus last February compares to a 19.0% y/y rate of decline at its worst, roughly one year ago.
The narrower 10 City Composite Index rose a seasonally adjusted 0.1% (1.5% y/y). Over the last year, prices rose 1.5% versus a 19.4% decline at its worst.
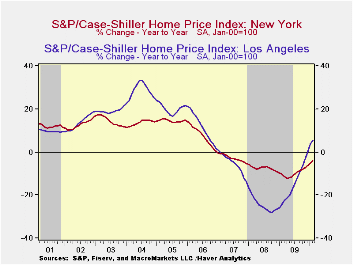
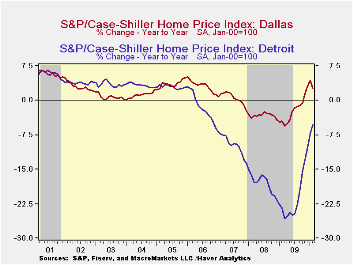
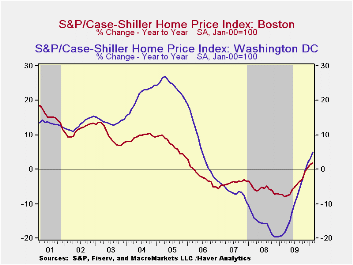
The performance of home prices continues to vary around the country. During February, the 12-month gain in prices was strongest in the West. Prices in Washington D.C. and Dallas rose moderately but widespread declines were logged elsewhere.
The Case-Shiller home price series are value-weighted, i.e., a greater index weight is assigned to more expensive homes. The S&P/Case-Shiller home price series can be found in Haver's USECON database and the city data highlighted below is in the REGIONAL database.
Achieving Fiscal Sustainability is the title of this morning's speech by Fed Chairman Ben S. Bernanke and it can be found here.
| S&P/Case-Shiller Home Price Index (SA) | February m/m | January m/m | December m/m | Feb. y/y | 2009 | 2008 | 2007 |
|---|---|---|---|---|---|---|---|
| 20 City Composite Index | -0.1 | 0.3 | 0.3 | 0.7 | -13.3 | -15.7 | -3.8 |
| Regional Indicators | |||||||
| Atlanta | -0.9 | -0.5 | 0.0 | -0.9 | -11.6 | -8.5 | 0.7 |
| Boston | -0.5 | 0.3 | 0.7 | 1.8 | -4.9 | -5.7 | -4.0 |
| Chicago | -1.0 | -0.8 | -0.7 | -2.9 | -14.2 | -10.0 | -1.0 |
| Dallas | -1.4 | -0.2 | 0.1 | 2.7 | -2.3 | -3.3 | 0.5 |
| Denver | -0.2 | -0.1 | -0.0 | 3.7 | -2.8 | -4.9 | -1.7 |
| Los Angeles | 0.2 | 1.9 | 1.2 | 5.4 | -15.4 | -24.2 | -5.2 |
| New York | -0.2 | -0.2 | -0.4 | -4.1 | -9.8 | -7.4 | -2.8 |
| San Francisco | 0.4 | 0.5 | 0.8 | 12.0 | -18.4 | -24.3 | -4.5 |

Tom Moeller
AuthorMore in Author Profile »Prior to joining Haver Analytics in 2000, Mr. Moeller worked as the Economist at Chancellor Capital Management from 1985 to 1999. There, he developed comprehensive economic forecasts and interpreted economic data for equity and fixed income portfolio managers. Also at Chancellor, Mr. Moeller worked as an equity analyst and was responsible for researching and rating companies in the economically sensitive automobile and housing industries for investment in Chancellor’s equity portfolio. Prior to joining Chancellor, Mr. Moeller was an Economist at Citibank from 1979 to 1984. He also analyzed pricing behavior in the metals industry for the Council on Wage and Price Stability in Washington, D.C. In 1999, Mr. Moeller received the award for most accurate forecast from the Forecasters' Club of New York. From 1990 to 1992 he was President of the New York Association for Business Economists. Mr. Moeller earned an M.B.A. in Finance from Fordham University, where he graduated in 1987. He holds a Bachelor of Arts in Economics from George Washington University.
More Economy in Brief


