 Global| May 26 2009
Case-Shiller Home Price Index Is Down By Nearly One-Third From 2006 Peak
by:Tom Moeller
|in:Economy in Brief
Summary
The S&P/Case-Shiller Composite 20 Home Price Index fell 2.2% during March. The latest decline lowered prices by 18.7% during the last twelve months and by 31.4% since their peak in May 2006. The series dates back only to 2000 and the [...]
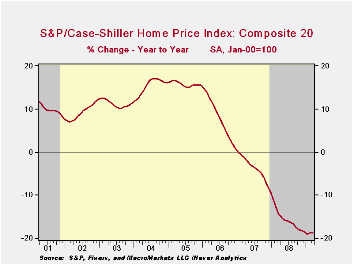 The S&P/Case-Shiller Composite 20
Home Price Index fell 2.2% during March. The latest decline lowered
prices by 18.7% during the last twelve months and by 31.4% since their
peak in May 2006. The series dates back only to 2000 and the
March decline in prices was as expected.
The S&P/Case-Shiller Composite 20
Home Price Index fell 2.2% during March. The latest decline lowered
prices by 18.7% during the last twelve months and by 31.4% since their
peak in May 2006. The series dates back only to 2000 and the
March decline in prices was as expected.
The S&P/Case-Shiller home price series can be found in Haver's USECON database and the city data highlighted below is in the REGIONAL database.
The Case-Shiller index of 20 U.S. cities and their surrounding areas is weighted to reflect price changes due to extensive remodeling, home additions or extreme neglect. For example, smaller weights are assigned to sales of homes that have undergone extensive remodeling.
The Case-Shiller composite index of homes in 10 metropolitan areas, which has a longer history and dates back to 1987, also fell 2.0% and was down 18.6% year-to-year. The measure was down 32.4% since the 2006 peak.
Weakest Regions: Home prices in Phoenix,
Nevada were quite weak and fell 36.0% y/y and in San Francisco prices
fell 30.0% y/y, off by nearly one half from their early-2006 peak. Home
prices in Las Vegas, Nevada fell 31.2% y/y and also were down by
roughly one half from their peak. Prices in Miami fell 28.7% y/y while
home prices in Los Angeles were down 22.3% y/y. In Tampa they fell
22.4% and in Detroit home prices dropped by 25.7% y/y, off 43.7% from
the peak.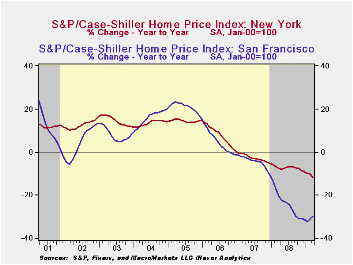
Less Weak Regions: In the Northeast, the decline in home prices continued less severe. Prices in New York fell 11.8% y/y, off 19.6% from their 2006 peak. Prices were down 8.0% year-to-year in Boston but in Chicago home prices were down a larger 18.6% y/y, off one-quarter from the 2007 peak. In Cleveland, Ohio the decline in home prices accelerated during February and they fell 1.0% m/m and 9.0% y/y but in Dallas prices were off by a moderate 5.5% y/y and by 9.1% from the 2007 peak. In Charlotte, North Carolina prices fell a moderate 9.3% y/y and in Denver home prices prices fell just 5.5% y/y.
The latest press release from Standard & Poor's can be found here. An overview of the S&P/Case-Shiller home price series can be found here.
The history of the Case-Shiller data is available in Haver's USECON database.
Remarks made by Fed Chairman Ben S. Bernanke on Dealing With The Reality of Unpredictability are available here.
| S&P/Case-Shiller Home Price Index (SA, Jan 00 = 100) | March | February | Y/Y | 2008 | 2007 | 2006 |
|---|---|---|---|---|---|---|
| 20 City Composite Index | 141.35 | 144.48 | -18.7% | -15.8% | -3.8% | 7.6% |

Tom Moeller
AuthorMore in Author Profile »Prior to joining Haver Analytics in 2000, Mr. Moeller worked as the Economist at Chancellor Capital Management from 1985 to 1999. There, he developed comprehensive economic forecasts and interpreted economic data for equity and fixed income portfolio managers. Also at Chancellor, Mr. Moeller worked as an equity analyst and was responsible for researching and rating companies in the economically sensitive automobile and housing industries for investment in Chancellor’s equity portfolio. Prior to joining Chancellor, Mr. Moeller was an Economist at Citibank from 1979 to 1984. He also analyzed pricing behavior in the metals industry for the Council on Wage and Price Stability in Washington, D.C. In 1999, Mr. Moeller received the award for most accurate forecast from the Forecasters' Club of New York. From 1990 to 1992 he was President of the New York Association for Business Economists. Mr. Moeller earned an M.B.A. in Finance from Fordham University, where he graduated in 1987. He holds a Bachelor of Arts in Economics from George Washington University.
More Economy in Brief


