 Global| Jun 29 2009
Business and Consumer Confidence Improve in the Euro Area
Summary
The European Commission's Business Climate Indicator for the Euro Area is designed to deliver a clear and early assessment of the cyclical situation. The extent that it has done so in the past can be seen in the first chart that shows [...]
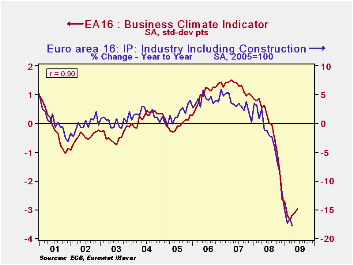
The European Commission's Business Climate Indicator for the
Euro Area is designed to deliver a clear and early assessment of the
cyclical situation. The extent that it has done so in the past can be
seen in the first chart that shows the Indicator and the year to year
change in industrial production. With a correlation between the two
series of 90%, 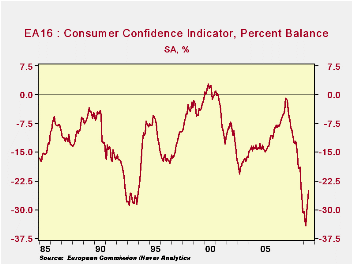 the R-Square is 81%, indicating that the business
climate indicator accounts for about 81% of the changes in the
industrial production. The rise in the indicator for the third
successive month in June is a good sign, but it is still at an
historically low level.
the R-Square is 81%, indicating that the business
climate indicator accounts for about 81% of the changes in the
industrial production. The rise in the indicator for the third
successive month in June is a good sign, but it is still at an
historically low level.
The individual results of the surveys of industry, the
construction, services, and retail trade businesses are reported as a
percent balances between those expecting improving and 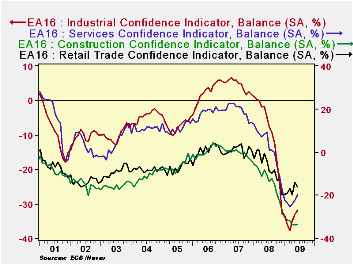 those expecting
deteriorating conditions in important aspects of business, such as
orders, production outlook, inventories, etc. Except for construction,
the other businesses have shown improvements over the last few months
as can be seen in the second chart.
those expecting
deteriorating conditions in important aspects of business, such as
orders, production outlook, inventories, etc. Except for construction,
the other businesses have shown improvements over the last few months
as can be seen in the second chart.
| European Commission: Confidence Measures | Jun 09 | May 09 | Apr 09 | Mar 09 |
|---|---|---|---|---|
| Business Climate Indicator (Pts of Std. Dev/) | -2.97 | -3.11 | -3.21 | -3.37 |
| Business Confidence (% Balance) | ||||
| Industry | -31.9 | -33.2 | -35.0 | -37.8 |
| Services | -19.8 | -22.5 | -24.2 | -25.4 |
| Construction | -33.5 | -33.7 | -33.6 | -31.8 |
| Retail Sales | -16.0 | -14.2 | -19.8 | -17.0 |
| Consumer Confidence (% Balance | -25.1 | -28.1 | -30.5 | -34.2 |
More Economy in Brief


