 Global| Aug 03 2009
Bottoming Of U.S. Construction Spending Evident For A Fifth Month
by:Tom Moeller
|in:Economy in Brief
Summary
It's been a long time coming, but a bottoming of the two-year decline in construction outlays arrived in 2008. During June, the value of overall construction put-in-place ticked up 0.3% after a little-revised 0.8% May slip, and the [...]
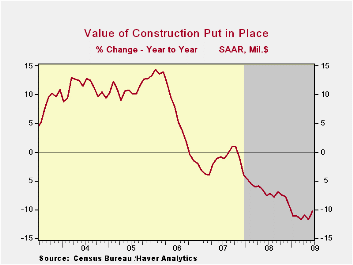
It's been a long time coming, but a bottoming of the two-year decline in construction outlays arrived in 2008. During June, the value of overall construction put-in-place ticked up 0.3% after a little-revised 0.8% May slip, and the latest beat expectations for a 0.5% decline. More to the point, however, was that outlays through June versus January fell just 2.1% (AR) versus the 9.9% three-month rate of decline through January.
Private nonresidential building outlays continued to support overall construction activity. Though the monthly increases so far this year have been small, the gains versus January lead to an 8.6% annual rate of growth and that reverses the decline through the beginning of this year.Spending in virtually all sectors has turned positive, notably in the education, health care and transportation areas. The rate of decline in office construction also has moderated but still is quite negative.
The best that can be pointed out about residential building activity is that there was a 0.5% uptick in June, but that only lessened the negative growth rate this year to -25.9%, half that at its worst. Single-family home construction is down by nearly half from its January level while multi-family construction fell the same 7% it did did in May (-33.1% y/y).Spending on improvements reversed all of a 1.2% May decline and have risen at a 12.3% annual rate since January.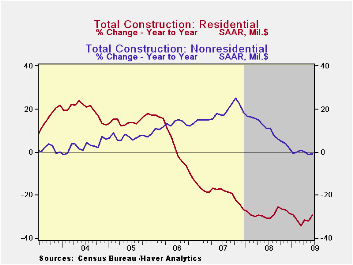
Public construction activity was firm again during June and the 1.0% gain lifted spending since January at quite-strong 17.9% rate since January. The increase has been led by strong gains in the heath care (24.0% y/y), educational (4.6% y/y) and transportation (+1.0% y/y) areas.
The construction put-in-place figures are available in Haver's USECON database.
| Construction (%) | June | May | Y/Y | 2008 | 2007 | 2006 |
|---|---|---|---|---|---|---|
| Total | 0.3 | -0.8 | -10.2 | -6.9 | -1.6 | 6.3 |
| Private | -0.1 | -1.4 | -16.3 | -11.1 | -5.7 | 5.5 |
| Residential | 0.5 | -3.1 | -30.0 | -29.1 | -19.7 | 1.0 |
| Nonresidential | -0.5 | -0.4 | -4.8 | 13.2 | 23.1 | 16.2 |
| Public | 1.0 | 0.4 | 5.1 | 5.6 | 13.1 | 9.3 |

Tom Moeller
AuthorMore in Author Profile »Prior to joining Haver Analytics in 2000, Mr. Moeller worked as the Economist at Chancellor Capital Management from 1985 to 1999. There, he developed comprehensive economic forecasts and interpreted economic data for equity and fixed income portfolio managers. Also at Chancellor, Mr. Moeller worked as an equity analyst and was responsible for researching and rating companies in the economically sensitive automobile and housing industries for investment in Chancellor’s equity portfolio. Prior to joining Chancellor, Mr. Moeller was an Economist at Citibank from 1979 to 1984. He also analyzed pricing behavior in the metals industry for the Council on Wage and Price Stability in Washington, D.C. In 1999, Mr. Moeller received the award for most accurate forecast from the Forecasters' Club of New York. From 1990 to 1992 he was President of the New York Association for Business Economists. Mr. Moeller earned an M.B.A. in Finance from Fordham University, where he graduated in 1987. He holds a Bachelor of Arts in Economics from George Washington University.
More Economy in Brief


