 Global| Jun 09 2006
April U.S. Trade Deficit Deepened Less Than Expected
by:Tom Moeller
|in:Economy in Brief
Summary
During April the U.S. foreign trade deficit deepened to $63.4B from a little revised $61.9B in March. The deficit fell short of Consensus expectations for $65.1B. The latest deficit was the deepest since the near-record in January of [...]
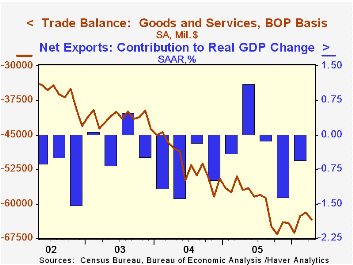
During April the U.S. foreign trade deficit deepened to $63.4B from a little revised $61.9B in March. The deficit fell short of Consensus expectations for $65.1B.
The latest deficit was the deepest since the near-record in January of $66.2B. During the first four months of 2006 the foreign trade deficit averaged $63.5B versus a $56.3B deficit averaged during the first four months of 2005.
Total exports slipped 0.2% in April after the 1.8% pop during March. Nonauto consumer goods exports led the decline with a 3.5% slide (+5.0% y/y) which reflected lower apparel & appliance (+12.2% y/y) exports that had been strong. Capital goods exports also slipped 0.5% (+9.2% y/y) while exports of advanced technology products fell 13.5% (NSA, +6.0% y/y). Exports of industrial supplies & materials rose 0.2% (13.4% y/y) and automotive exports rose 1.0% (8.9% y/y).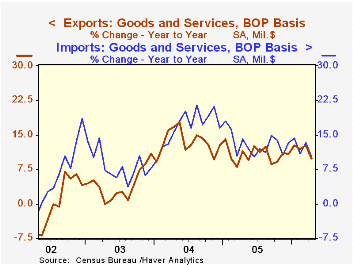
April imports rose just 0.7% though a 6.4% (22.5% y/y) rise in petroleum imports wholly reflected higher prices. In constant dollars petroleum imports fell 3.7% (-5.2% y/y). The per day quantity of all energy-related petroleum product imports fell 1.5% (-5.1% y/y) but crude oil prices rose 8.7% (26.9% y/y) to an average $56.82 per bbl.
Imports of capital goods ticked up 0.3% (8.8% y/y) and are up 4.7% year to date. Imports of advanced technology products fell 15.1% (NSA, +2.9% y/y) and imports of nonauto consumer goods fell 3.5% (+5.0% y/y).
The US trade deficit with China deepened to $17.0B ($201.6B for 2005) while the trade deficit with Japan deepened to $7.8B ($82.7B in 2005). The trade deficit with the Asian NICs rose to a still modest $0.7B ($15.9B in 2005). Growth in both exports & imports with the Asian NICs has been firm. The deficit with the European Union eased to $9.4B ($122.4B in 2005).
| Foreign Trade | April | March | Y/Y | 2005 | 2004 | 2003 |
|---|---|---|---|---|---|---|
| Trade Deficit | $63.4B | $61.9B | $57.0B (4/05) | $716.7B | $611.3B | $494.9B |
| Exports - Goods & Services | -0.2% | 1.8% | 9.8% | 10.7% | 13.4% | 4.2% |
| Imports - Goods & Services | 0.7% | 0.7% | 10.3% | 13.0% | 16.7% | 8.3% |

Tom Moeller
AuthorMore in Author Profile »Prior to joining Haver Analytics in 2000, Mr. Moeller worked as the Economist at Chancellor Capital Management from 1985 to 1999. There, he developed comprehensive economic forecasts and interpreted economic data for equity and fixed income portfolio managers. Also at Chancellor, Mr. Moeller worked as an equity analyst and was responsible for researching and rating companies in the economically sensitive automobile and housing industries for investment in Chancellor’s equity portfolio. Prior to joining Chancellor, Mr. Moeller was an Economist at Citibank from 1979 to 1984. He also analyzed pricing behavior in the metals industry for the Council on Wage and Price Stability in Washington, D.C. In 1999, Mr. Moeller received the award for most accurate forecast from the Forecasters' Club of New York. From 1990 to 1992 he was President of the New York Association for Business Economists. Mr. Moeller earned an M.B.A. in Finance from Fordham University, where he graduated in 1987. He holds a Bachelor of Arts in Economics from George Washington University.
More Economy in Brief


