 Global| May 16 2002
April Housing Starts Down More Than Expected
by:Tom Moeller
|in:Economy in Brief
Summary
Housing starts fell more than expected last month. March starts were little revised though there were small revisions back to last year. Single-family starts fell 2.0% following a 12.0% drop in March, suggesting that warm temperatures [...]
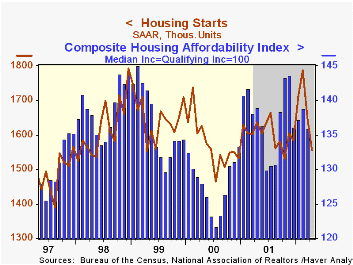
Housing starts fell more than expected last month. March starts were little revised though there were small revisions back to last year.
Single-family starts fell 2.0% following a 12.0% drop in March, suggesting that warm temperatures lifted activity this past winter.
Multi-family starts fell 18.1% following a strong March gain.
Starts fell in each of the country's regions except for a 5.6% gain in the South.
Building permits rose slightly after a steep March decline.
| Housing Starts (000s, AR) | April | Mar | Y/Y | 2001 | 2000 | 1999 |
|---|---|---|---|---|---|---|
| Total | 1,555 | 1,644 | -5.0% | 1,603 | 1,573 | 1,647 |
| Single Family | 1,270 | 1,296 | -2.5% | 1,273 | 1,232 | 1,306 |
| Multi Family | 285 | 348 | -14.7% | 330 | 341 | 341 |
by Tom Moeller May 16, 2002
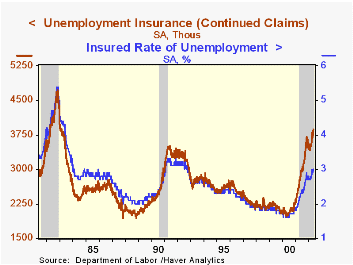
Initial claims for unemployment insurance rose unexpectedly in the latest week. The prior week's level was revised up slightly.
Continuing claims for unemployment insurance rose strongly. The prior week's level was revised down. Continuing claims were at the highest level since February 1983.
The four-week moving average of claims fell to 420,750.
The insured rate of unemployment rose to 3.0%. The prior week's level was revised down slightly
| Unemployment Insurance (000s) | 5/11/02 | 5/04/02 | Y/Y | 2001 | 2000 | 1999 |
|---|---|---|---|---|---|---|
| Initial Claims | 418.0 | 416.0 | 5.3% | 405.8 | 299.8 | 297.7 |
| Continuing Claims | -- | 3,862 | 38.0% | 3,021 | 2,114 | 2,186 |
by Tom Moeller May 16, 2002
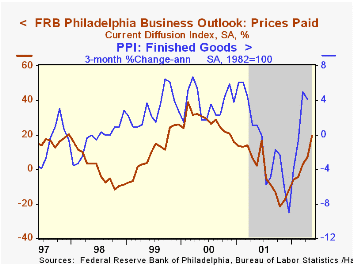
The Philadelphia Fed’s index of general business conditions for May fell more than expected.
New orders, unfilled orders and inventories fell and delivery lead times eased for the second month. Inventories fell to the lowest level since last September.
The business conditions index reflects a separate survey question, not the components.
Pricing pressure firmed to the highest level since November 2000.
| Philadelphia Fed Business Outlook | May | April | Y/Y | 2001 | 2000 | 1999 |
|---|---|---|---|---|---|---|
| General Activity Index | 9.1 | 12.3 | -11.9 | -17.3 | 8.2 | 13.3 |
| Prices Paid Index | 19.7 | 7.5 | 2.3 | -1.0 | 27.1 | 10.0 |

Tom Moeller
AuthorMore in Author Profile »Prior to joining Haver Analytics in 2000, Mr. Moeller worked as the Economist at Chancellor Capital Management from 1985 to 1999. There, he developed comprehensive economic forecasts and interpreted economic data for equity and fixed income portfolio managers. Also at Chancellor, Mr. Moeller worked as an equity analyst and was responsible for researching and rating companies in the economically sensitive automobile and housing industries for investment in Chancellor’s equity portfolio. Prior to joining Chancellor, Mr. Moeller was an Economist at Citibank from 1979 to 1984. He also analyzed pricing behavior in the metals industry for the Council on Wage and Price Stability in Washington, D.C. In 1999, Mr. Moeller received the award for most accurate forecast from the Forecasters' Club of New York. From 1990 to 1992 he was President of the New York Association for Business Economists. Mr. Moeller earned an M.B.A. in Finance from Fordham University, where he graduated in 1987. He holds a Bachelor of Arts in Economics from George Washington University.
More Economy in Brief


