 Global| Nov 28 2006
Air Came Out of U.S. Durable Orders, Tech Off As Well
by:Tom Moeller
|in:Economy in Brief
Summary
An 8.3% decline in new orders for durable goods last month more than reversed an upwardly revised 8.7% surge during September. The volatility largely reflected first the near-tripling of civilian aircraft & parts orders during [...]
An 8.3% decline in new orders for durable goods last month more than reversed an upwardly revised 8.7% surge during September. The volatility largely reflected first the near-tripling of civilian aircraft & parts orders during September then a 37.4% decline last month. Consensus expectations had been for a 5.0% in total orders during October.
Additional weakness last month was provided by a 10.2% (+3.3% y/y) decline in orders for computers & electronic products that very much reflected a 25.6% (-24.6% y/y) drop in computers.
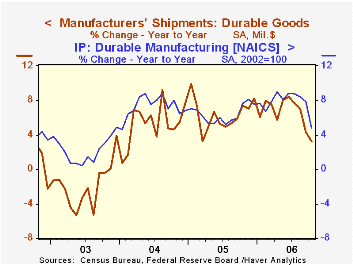
During the last ten years there has been a 69% correlation between the y/y change in durable goods orders and the change in output of durable goods..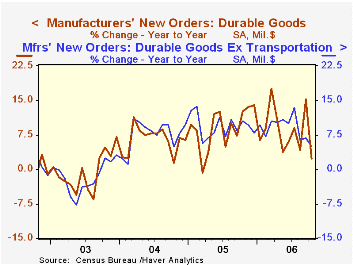
Orders for nondefense capital goods dropped 15.6% and less aircraft they were off 5.1%. Offsetting the slide in computer orders was a 1.4% (13.4% y/y) increase in new orders for machinery and a 5.1% (8.4% y/y) rise in electrical equipment & appliances. During the last ten years there has been an 86% correlation between the y/y change in capital goods orders less aircraft and the y/y change in business fixed investment in equipment & software from the GDP accounts.
Orders for motor vehicles & parts rose 1.4% (-9.5% y/y) while primary metals orders increased 1.1% (7.4% y/y).
Durable goods orders less transportation fell 1.7% after an upwardly revised 0.5% October increase. Consensus expectations had been for a 0.1% rise in total orders less transportation.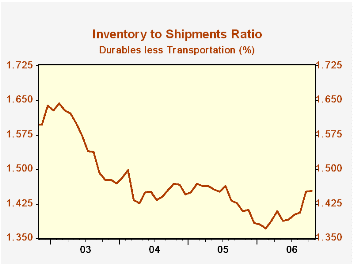
Shipments of durable goods increased a slight 0.6% (3.3% y/y) after a little revised 2.7% October tumble. Less the transportation sector shipments rose a similar 0.5% (5.8% y/y) after a 2.2% slide the prior month. During the last ten years there has been an 82% correlation between the y/y change in durable goods shipments and the change in industrial production of durable goods.
Order backlogs rose another 1.2% (21.8% y/y) and less transportation rose 0.9% (13.2% y/y). Unfilled orders for nondefense aircraft & parts surged by 2.4% (53.9% y/y).
Durable inventories rose 0.8% (8.2% y/y). Less the transportation sector inventories rose 0.6% (9.1% y/y) and the inventory to shipments ratio outside of transportation added to its September surge.
| NAICS Classification | October | September | Y/Y | 2005 | 2004 | 2003 |
|---|---|---|---|---|---|---|
| Durable Goods Orders | -8.3% | 8.7% | 2.3% | 9.0% | 6.4% | -0.6% |
| Excluding Transportation | -1.7% | 0.5% | 4.9% | 9.4% | 7.6% | -1.7% |
| Nondefense Capital Goods | -15.6% | 24.7% | 8.5% | 21.4% | 5.6% | -3.4% |
| Excluding Aircraft | -5.1% | 3.2% | 6.2% | 12.3% | 2.8% | -2.0% |

Tom Moeller
AuthorMore in Author Profile »Prior to joining Haver Analytics in 2000, Mr. Moeller worked as the Economist at Chancellor Capital Management from 1985 to 1999. There, he developed comprehensive economic forecasts and interpreted economic data for equity and fixed income portfolio managers. Also at Chancellor, Mr. Moeller worked as an equity analyst and was responsible for researching and rating companies in the economically sensitive automobile and housing industries for investment in Chancellor’s equity portfolio. Prior to joining Chancellor, Mr. Moeller was an Economist at Citibank from 1979 to 1984. He also analyzed pricing behavior in the metals industry for the Council on Wage and Price Stability in Washington, D.C. In 1999, Mr. Moeller received the award for most accurate forecast from the Forecasters' Club of New York. From 1990 to 1992 he was President of the New York Association for Business Economists. Mr. Moeller earned an M.B.A. in Finance from Fordham University, where he graduated in 1987. He holds a Bachelor of Arts in Economics from George Washington University.
More Economy in Brief


