 Global| Feb 27 2012
A Note on the Bank of Korea's Survey of Business Conditions Index
Summary
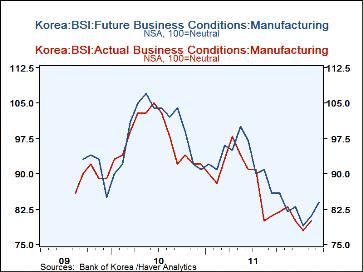
The March survey of business conditions surveyed by the Bank of Korea shows improvement from 78 in January to 80 in February in actual conditions in Korean manufacturing industry and from 81 in February to 84 in March in what is [...]
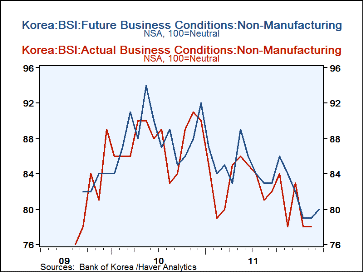
The March survey of business conditions surveyed by the Bank of Korea shows improvement from 78 in January to 80 in February in actual conditions in Korean manufacturing industry and from 81 in February to 84 in March in what is called the future tendency. In nonmanufacturing industries the index for actual conditions declined by one point to 78 in February but the future tendency rose from 79 in February to 80 in March. In spite of these improvements, the overall indexes continue below the 100 mark, which means that the participants in the surveys view who view current conditions and future tendencies in both manufacturing and non manufacturing industries negatively outweigh those who view the outlook positively. The actual conditions and future tendencies for the manufacturing and non manufacturing industries are shown in the attached charts.
Most surveys of business or consumer opinions express the results as balances of opinion. The Bank of Korea computes an index by subtracting the percentage of negative opinions from the percentage of positive opinions and then adds 100% to the difference. Thus if the percentage of positive opinion equals the percentage of negative opinion, the difference is zero indicating an overall neutral opinion. By adding 100%, the Bank of Korea is simply expressing the neutral point at 100 as opposed to 0 in the usual presentations. Thus if, say, 40% of the participants register a positive opinion and 60% a negative, most surveys would record a percent balance of -20%. The Bank of Korea shows an index of 80 which is 20% below the neutral position.
12
12
12
11
11
11
11
11
11
11
11
More Economy in Brief
 Global| Feb 05 2026
Charts of the Week: Balanced Policy, Resilient Data and AI Narratives
by:Andrew Cates


